A.P. Schinckel, D.L. Lofgren, and T.S. Stewart
Department of Animal Sciences
Prediction equations for estimating fat-free lean mass are widely used in the pork industry. The prediction of fat-free lean has two possible sources of error. The first is the level of measurement errors (or accuracy) of the carcass measurements used in the development of the prediction equations. The second is the level of carcass measurement errors in subsequent carcass data.
Currently, two opinions exist as the most appropriate method to develop prediction equations. One opinion is that if the prediction equation is to be used in specific conditions (speed, accuracy, rate of errors, etc.), the prediction equation should be developed under similar conditions. The second opinion is that the prediction equations should always be developed from carcass measurements which are as accurate as possible.
The objective of this study was to evaluate the effects of measurement errors in the development of prediction equations and in subsequent data utilizing the prediction equations.
Materials and Methods
Prior simulation resulted in the development of 50 subsets of nine genetic populations with 16 pigs/sex in each genetic population (288 total observations per subset). Carcass weight (CW, lbs), fat depth (FD, in.), and muscle depth (MD, in.) were simulated. Fat-free lean mass (lbs) was calculated as:
FFLM = 10.23 + (.459 x CW) - (24.7 x FD) + (6.55 x MD) + eij
where eij was a random error assigned to each pig. Measurement errors were simulated for each pig, such that the relationship of the carcass FD and MD measurements with FFLM were decreased by 15, 30 and 45% from the levels with no errors (0%). Prediction equations were developed for each subset at the four levels of measurement errors (M0, M15, M30 and M45). An independent, large data set was simulated for an out-of-sample analysis to evaluate the efficacy of the derived prediction equations. This data set contained 40 genetic populations and 80 pigs/sex in each genetic population (6400 total pigs). Four levels of measurement errors were simulated for these pigs (P0, P15, P30, P45). This resulted in a large overall data set, which included the use of equations which were developed from data with four levels of measurement errors, and each equation used on pig data with four levels of measurement errors (Table 1).
Statistics were examined to evaluate the magnitude of genetic population and sex biases. The variance ratio (VR) is the variation of the predicted genetic population means divided by the variation of the actual genetic population means. The correlation (CR) between the true and predicted genetic population means was evaluated. Also, the predicted difference in FFLM between the barrows and gilts was estimated.
Results
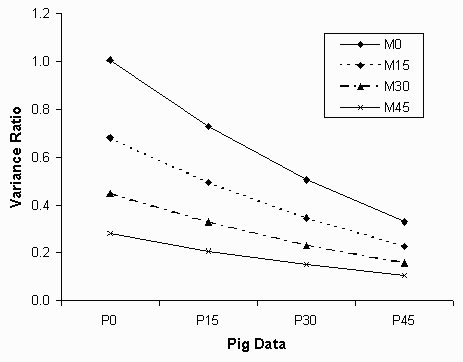
Measurement errors, either in the data points of the prediction equation (M) or in the actual pig data (P) reduced the VR values (Figure 1). When the equations were developed without errors (M0) and pig data was without measurement errors (P0), the VR were all close to 1.00 and CR close to .99. With any measurement errors, the VR decreased. The CR were high (CR > .85), indicating that in general the genetic populations were ranked correctly, even when measurement errors were present. However, the VR decreased 30% with each increase in measurement error level (equation data or pig data), such that with the highest levels (M45-P45), VR averaged only .11. Thus, only 11% of the true differences between the populations was detected.
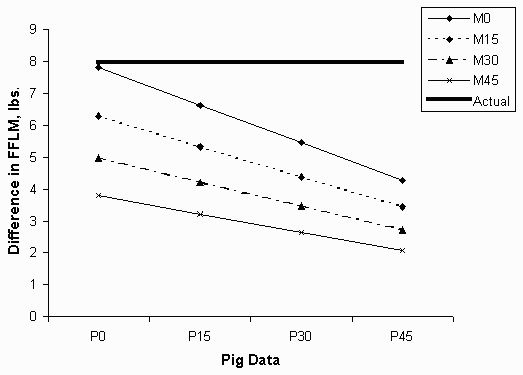
Predicted sex differences decreased in a similar pattern (Figure 2). In general, the lean content of barrows was overestimated and gilts underestimated. With the highest levels of measurement errors, only 28% of the actual sex difference was predicted.
For a given level of measurement error in the pig data, equations developed using data with the least measurement errors resulted in the smallest genetic population and sex biases. The simulation results indicate that regardless of the level of measurement error in future carcass measurements, the prediction equations should be developed under conditions and by personnel which result in the smallest magnitude of measurement errors. This will result in the highest correlations of FD and MD with FFLM, and the most accurate equations in terms of their ability to estimate true genetic population and sex differences.
Regression analyses assume that the independent variables, MD and FD in this study, are measured without error. In reality, instruments such as optical probes, rulers and ultrasound devices are sensitive to operator error. These statistics indicate that the primary impact of measurement errors, either in the prediction equation or pig data, is a systematic bias with overestimation of the lean content of the low percent lean genetic populations and underestimation of the lean content of the high percent lean genetic populations. The changes in rank, caused by the measurement errors, were secondary.
The data used to develop prediction equations usually only involves 200 to 700 observations. These carcass measurements should be done only by the best trained individuals under the best possible conditions. If inaccurate measurements are used in the development of the prediction equations, the prediction equations will result in biased estimates of lean mass and value on a multitude of market pigs.
This study used data from 288 pigs from 9 genetic populations to develop the prediction equations. A larger number of observations results in smaller standard errors of regression coefficients. The number of observations does not reduce the magnitude of the biases produced by using inaccurate measurements. For this reason, prediction equations developed from 200 carefully collected, accurate measurements may result in more accurate equations, in terms of their ability to predict true genetic population and sex differences, than prediction equations based on a much larger number of less accurately collected carcass measurements.
Pork processors should also implement procedures to train their employees to collect the measurements as accurately as possible. However, at line speeds of 800 to 1000 pigs per hour, some low level of measurement error will likely exist. At these speeds, not every measurement is going to be taken exactly as the same anatomical location and angle.
Implications
The accuracy of the carcass measurements either in the development of the prediction equations or subsequent pig data substantially reduce the ability to accurately evaluate pigs of different genetic populations and sexes. Measurement errors should always be minimized, especially in the data used to develop the prediction equations. Prediction equations should undergo evaluation of potential biases before widespread use.
Table 1. Combinations of measurement errors for Model Data, used to derive regression equations, and Pig Data, used to evaluate those equations.
|
|
|
Model Data (M); 50 subsets of data for each |
|||
|
|
Meas. |
|
|
|
|
|
Pig |
0% |
M0-P0 |
M15-P0 |
M30-P0 |
M45-P0 |
|
15% |
M0-P15 |
M15-P15 |
M30-P15 |
M45-P15 |
|
|
30% |
M0-P30 |
M15-P30 |
M30-P30 |
M45-P30 |
|
|
45% |
M0-P45 |
M15-P45 |
M30-P45 |
M45-P45 |
|
a
0% = No measurement error;

Figure 1. Least squares means for the variance ratio statistic.

Figure 2. The predicted difference between barrows and gilts in FFLM.