C. J. Walukonis1, M. T. Morgan2,
D. E. Gerrard1, and J. C. Forrest1
Departments of 1Animal Sciences and 2Agricultural and
Biological Engineering
Introduction
Water-holding capacity is the ability of muscle to retain naturally occurring moisture. Current methods used to estimate water-holding capacity of postmortem (PM) muscle by means of measuring drip loss are time-consuming (Offer and Trinick, 1983).
Some methods to predict water-holding capacity use gravity, centrifugation, and other external and capillary forces (Honikel, 1998; Rasmussen and Andersson, 1996; Warriss, 2000; Hamm, 1986). Gravitational techniques include the hanging bag method proposed by Honikel (1998) and the Danish drip tube method developed by Rasmussen and Andersson (1996). Both of these methods require that muscle samples be removed at 24 h PM and allowed to “drip” for a given period of time, typically 24 h. Alternatively, centrifugation methods subject meat samples to centrifugal force involving high speeds and gravitational forces. This artificially-induced force results in a supernatant decanted as exudate. The muscle sample is weighed before and after centrifugation to determine the amount of moisture lost and the corresponding water-holding capacity can be predicted (Hamm, 1986; Warriss, 2000).
In addition to the cost of equipment that may be needed, each of these methods is tedious and cumbersome. Therefore, the objective of this study was to develop a rapid, relatively inexpensive technique for predicting water-holding capacity early postmortem.
Materials and Methods
Carcasses and loins:
pH:
Absorption:
Drip loss:
Results and Discussion
Selected carcasses were electrically stimulated to induce variation in drip loss and in pH. Electrical stimulation was developed as a means of inducing the formation of the pale, soft and exudative (PSE) quality defect in pork. Although PSE in its classical sense did not develop in any of the carcasses in this present study, ES carcasses had higher (P < 0.05) drip loss values than NS carcasses (4.77% vs. 2.56%). The decline in pH values for carcasses in Experiment 1 is shown in Figure 2 demonstrating that ES carcasses have lower pH values than NS carcasses after the stimulation treatment was performed (P < 0.05). ES carcasses also had lower ultimate pH (24 h) than NS carcasses (P < 0.05).
Individual absorption values for Experiment 1 are summarized in Figure 3. Material from ES carcasses absorbed numerically more moisture than NS carcasses from 60 min to 120 min PM and significantly more moisture at 1440 min PM (P < 0.05). Material from ES carcasses was expected to absorb more moisture than the material from NS carcasses due to the predicted difference in water-holding capacity between the two treatments.
Accumulated absorption values for Experiment 1 reflect the summation of moisture absorbed over time. The results are shown in Figure 4. Again, the ES carcasses absorb more total moisture than the NS carcasses at 1440 min (P < 0.05). A similar trend occurs at 75 min PM as did at 60 min PM for the individual values with material from NS having numerically more cumulative moisture than material from ES carcasses during early postmortem time points. After 75 min PM, the material from ES carcasses absorbs more moisture than NS carcasses.
The percent of total accumulated absorption, shown in Figure 5, was determined by dividing the accumulated absorption values at each time point by the total absorption at 1440 min PM. Material from NS carcasses absorb a higher percentage (61.8%) of the total moisture earlier than material from ES carcasses (51.6%) within the first 120 min of the experiment (P < 0.05). Material from ES absorbs a higher percentage of the total accumulated moisture between 120 min PM and 1440 min PM than the material from NS carcasses. The stimulation treatment may cause a change in the biochemical properties of those treated carcasses causing them to withhold more moisture earlier than non-treated carcasses before an exaggerated moisture release. The percent of total absorption for material from ES carcasses was delayed by approximately 30 min compared to the material of NS carcasses.
The differences between the two locations for individual and accumulated absorption are shown in Figure 6. Comparisons are made between locations for individual and accumulated absorption. Material inserted at the 9th rib location absorbed more moisture than the material inserted at the 12th rib. However, a greater relationship exists between absorption values and drip loss at the 12th rib location than at the 9th rib location. Absorption measurements should be collected at the 12th rib location because of its better relationship to drip loss measurements. Correlation coefficients (r-values) between individual absorption values and drip loss for each location are shown in Table 1. The relationship between absorption and drip loss becomes significant as early as 75 min PM. The highest correlation coefficient exists between the individual absorption at the 12th rib at 105 min PM with an r-value of 0.78. For practical experimental concerns, the material at this time point offers an easy way to predict drip loss and reflects material inserted at 90 min PM and removed at 105 min PM when the measurement occurs.
The relationship between absorption values and drip loss for Experiment 2 is shown in Figure 7. At 24 h PM, absorptive material was inserted in the carcasses at both the 12th and 9th rib locations and was left in the muscle for either 15 or 45 minutes. The material from the 45 min dwell time shows a better relationship between absorption and drip loss with the absorption values (the average between the absorption values at each location) explaining 35% of the variation in the drip loss values. The 15 min dwell time explains only 31% of the variation in drip loss. It is intuitive that leaving the material in the muscle longer will have a better relationship with drip loss since the material is allowed more time to absorb any available moisture. From these results, it can be concluded that the absorption technique performs better at predicting drip loss during earlier times PM than at 24 h.
Conclusions
Current methodologies for determining water-holding capacity, a primary determinate of pork quality, are time-consuming. Results from this study suggest that using an absorptive material may be a useful and accurate means of predicting water-holding capacity during the early postmortem period.
References
Hamm, R. 1986. Functional properties of the myofibrillar system and their measurements. Muscle as Food. Academic Press, Inc.
Honikel, K.O. 1998. Reference methods for the assessment of physical characteristics of meat. Meat Sci. 49: 447-457.
Offer, G. and Trinick, J. 1983. On the mechanism of water-holding in meat: The swelling and shrinkage of myofibrils. Meat Sci. 8: 245-281.
Rasmussen, A. J. and Andersson, M. 1996. New method for determination of drip loss in pork muscles. Proc. 42nd Int. Congr. Meat Sci. and Tech.
Warriss, P. D. 2000. Meat Science: An introductory text. CABI Publishing.
Acknowledgements
The authors would like to acknowledge Jason Hammelman, a former graduate student, who assisted with the initial development of the absorption technique. We would also like to acknowledge the employees of MSREC at Purdue University for their assistance.
Table 1. Correlation coefficients (r-values) between individual absorption values and loin drip loss values for Experiment 1
|
Time PM |
12th rib |
9th rib |
|
30 min |
- |
- |
|
45 min |
- |
- |
|
60 min |
- |
0.48 |
|
75 min |
0.54 |
0.72 |
|
90 min |
0.61 |
0.62 |
|
105 min |
0.78 |
0.67 |
|
120 min |
0.75 |
0.54 |
|
1440 min |
0.70 |
0.67 |
Only significant (P < 0.05) values are reported.
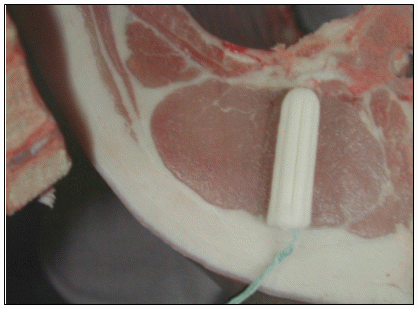
Figure 1. Absorptive material was inserted into the longissimus muscle as shown here through a plus-shaped incision through the subcutaneous fat layer at the 12th and 9th ribs.
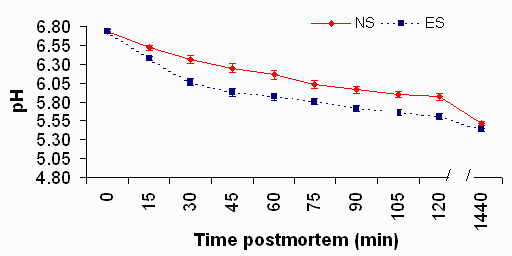
Figure 2. Decline in pH values for carcasses in Experiment 1 showing that the use of electrical stimulation (ES) causes carcasses to have lower pH values than non-stimulated (NS) carcasses. Stimulation also results in higher drip loss values.
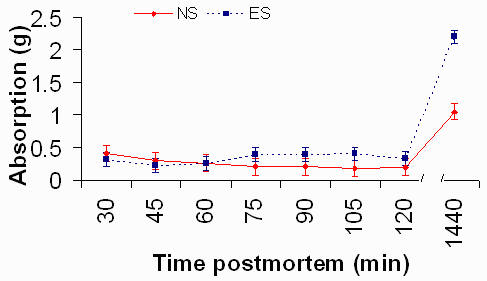
Figure 3. Individual absorption values for each time point during Experiment 1. Material from electrical stimulation (ES) carcasses absorbs more moisture (P < 0.05) at 1440 min postmortem than material from non-stimulated (NS) carcasses. The differences between the other time points are not significant.
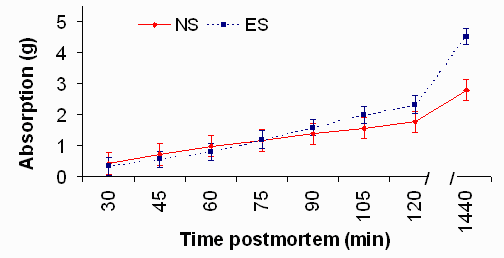
Figure 4. Accumulated absorption values for Experiment 1 showing that material from electrical stimulation (ES) carcasses absorbs more moisture (P < 0.05) by 1440 min postmortem than material from non-stimulated (NS) carcasses. The differences between the other time points are not significant.
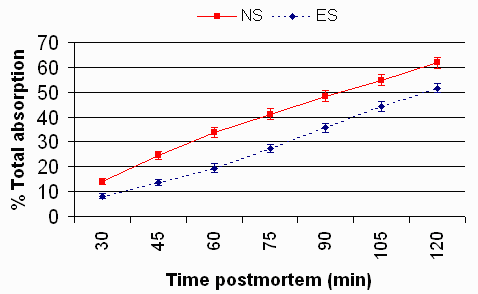
Figure 5. The percent of total accumulated absorption for each time point during the first 120 min postmortem of Experiment 1 is shown above. Material from non-stimulated (NS) carcasses absorbs more moisture as a percentage than material from electrical stimulation (ES) carcasses, which are delayed by approximately 30 min.
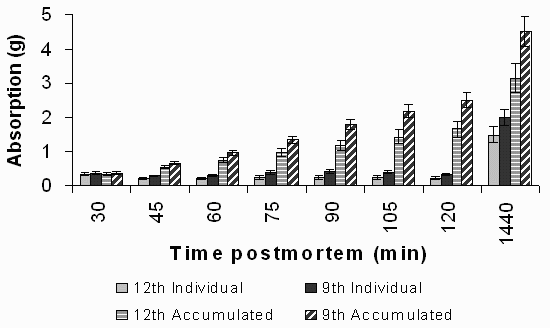
Figure 6. Individual and accumulated absorption values for each location in Experiment 1 are shown. Material from the 9th rib location absorbs more moisture than the 12th rib location; however, a greater relationship exists between absorption at the 12th rib location and loin drip loss.
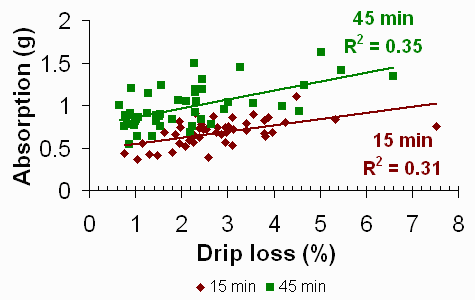
Figure 7. The relationship between absorption values and drip loss for Experiment 2 showing that the absorption from material during the longer dwell time (45 min) explains more variation in loin drip loss than the material from the shorter dwell time when conducted at 24 h postmortem.