Purdue University 1997 Swine Day Report
A.J. Heber, R.K. Duggirala, J. Ni, M.L. Spence, B.L. Haymore,
V.I. Adamchuk, D.S. Bundy, A.L. Sutton, and K.M. Keener
Department of Agricultural and Biological Engineering; Monsanto Enviro-Chem
Systems, St. Louis, MO; Microbe Inotech Laboratories, St. Louis, MO; Department
of Animal Sciences; and Department of Agricultural and Biosystems Engineering,
Iowa State University
Most of the pigs produced in Indiana are finished in large enclosed buildings with slotted floors and long term underfloor manure storage. Of the 130 trace gases in the air of animal houses, concentrations are known for only 23 (Hartung and Phillips, 1994), of which NH3, CO2 and H2S are the most important. However, most of the quantitative information, especially on emission rates, of these three gases in large swine buildings is somewhat lacking. The reported NH3 emission rates from swine houses range from 3.4 to 78.9 lb per 100 lb of live weight per year depending on housing types (Hartung and Phillips, 1994). Measurement of NH3 emissions from large swine houses in North America has not been found in the available literature. The only reported field investigation of CO2 emission was in Belgium with a small house of less than 70 pigs (Ni et al., 1996). Measured concentrations of H2S in pig houses were from 3.75x10⁻⁸ to 1.25x10⁻⁶ lb/ft3 (Muehling, 1970; Goedseels, 1973; and Hartung and Phillips, 1994), but emission rates were not determined. The objective of this research was to evaluate the effectiveness of a commercially available manure additive (Alliance™) to reduce noxious gas emissions from hog buildings and gas levels inside the buildings.
Field tests of the manure additive were conducted in two buildings with growing and finishing pigs (Figure 1). These 1993 buildings had the following characteristics: (1) naturally-ventilated with inverted-V chimney roof and curtain sidewalls, (2) flat, 7'6" high ceiling with 5.5" blown-in insulation, (3) ventilation chimney 3'11" wide at the ceiling and 8" wide at the uncapped ridge with 5.5" batt insulation, (4) ridge closure consisting of a PVC tube controlled manually, (5) one-room, 40'x180' building holding up to 1000 pigs that start at 55 lb each, (6) totally-slotted floor and no pit ventilation, and (7) all-in, all-out production.
These buildings had two air exhausts: the inverted-V shaped chimney, and the downwind sidewall curtain opening. However, the chimney is the sole exhaust of air a large percentage of the time, especially during cold weather, and exhausts air of the "average" condition during wind-induced crossflow. The chimney acts as a large sampling port and is relatively low (7'6" above the floor), 3'11" wide or 10% of the building width, near the human breathing zone, only 5' above the pigs, and furthest from the fresh air inlets and noxious gas sources (e.g., fresh dung, underfloor slurry, animal breath, and floor litter).
The buildings were oriented E-W with the ends connected by a small work room. The east building was treated with additive and the west building was used as the control (no treatment). Instrumentation was housed in a 6'7" x 15'1" clean environmentally-controlled instrument room constructed inside the work room.
The chemical solution was sprayed into the top of the pit creating an aerial mist in the headspace and covering the entire surface of the manure slurry (Figure 1, top). There was one nozzle in each of the 40 pens and spraying was controlled by a programmable logic controller. The spray cycle consisted of spraying alternate nozzles on each side of the barn for two minutes each, for a total cycle time of eight minutes and three cycles per day. The amount of chemical sprayed was 0.066% of the manure production of 9,920 lb per day.
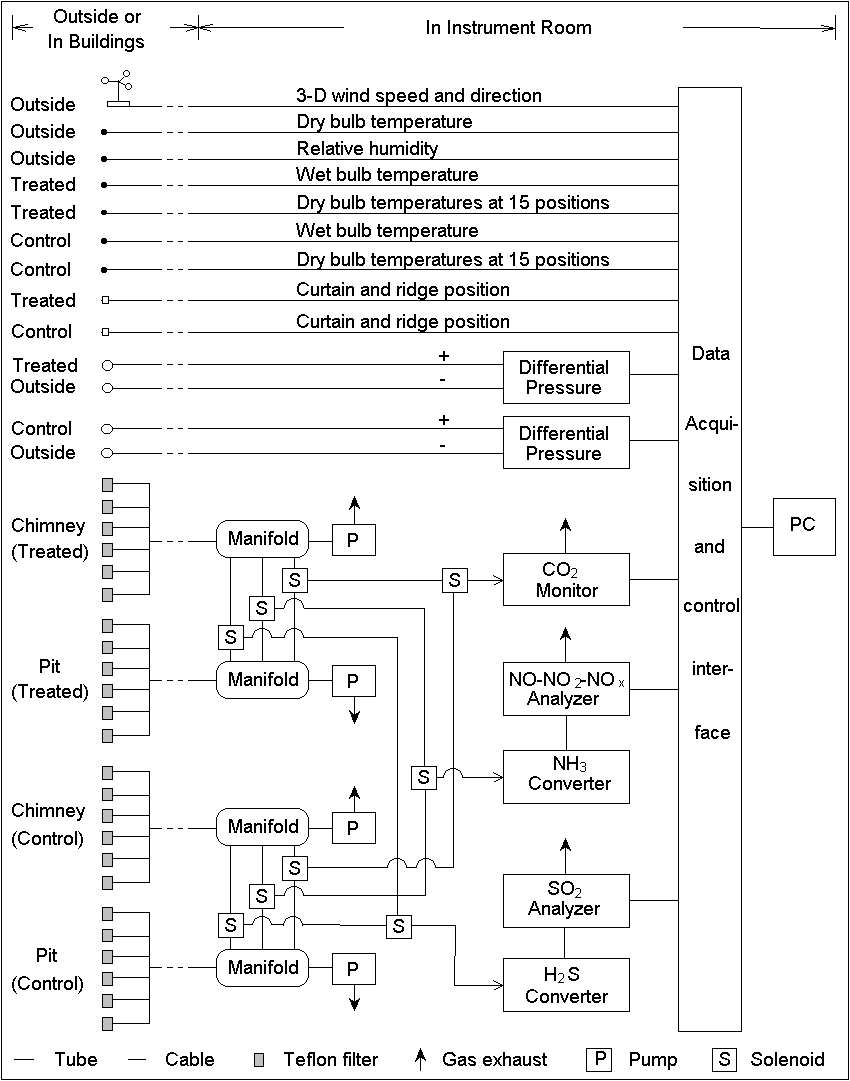
Inside air was pumped continuously through two sampling lines at 0.21 cfm from inside each building into the instrumentation room. A six-port combining manifold was used with each line inside the building to mix filtered air from six locations (Figure 2). The first gas stream was obtained from six points located 6" beneath the floor in order to assess pit headspace concentrations. The second gas stream was obtained from six points along the length of the chimney to assess gas emission rates (Figure 1).
Ammonia was converted to nitric oxide (NO) with a solid state converter at 1607°F. The NO was measured with a chemiluminescence detector. Hydrogen sulfide was converted to sulfur dioxide (SO2) that was monitored by the pulsed fluorescent technique. Carbon dioxide was measured with a photoacoustic infrared gas sensor. The gas instruments were calibrated twice weekly with specially-blended certified gases.
Each gas analyzer was switched sequentially between four ported manifolds (two per room) in the instrument room, and sampled from each manifold for 15 minutes. Data collected during the last ten minutes were averaged to determine gas concentration.
A ±0.1 iwg pressure sensor was utilized to measure building static pressure. A temperature and relative humidity probe with ±0.5°F and ±2.0% accuracy respectively, and protected by a radiation shield, was used for outside measurements. Wind speed and direction was measured with a 0.06 to 197 ft/s, three-dimensional, ultrasonic anemometer located 33' above the ground and 30' away from the building.
The determination of ventilation airflow rate in these naturally ventilated buildings with large slot openings necessitated the use of an indirect method. The heat balance method chosen for this project consisted of sensible heat lost by conduction through the building envelope, heat lost by ventilation airflow, and heat produced by the pigs. The heat lost from the building was estimated using standard heat conduction equations based on thermal resistances and building dimensions. The sensible heat produced by the pigs was estimated with heat production equations (CIGR, 1992) based on number and weight of the animals and the ambient temperatures measured near the pigs (Figure 1).
Gas emission rates were determined by multiplying the outlet gas concentration measured in the chimney outlet by the mass flow rate of ventilating air estimated by the sensible heat balance. Incoming concentrations of H2S and NH3 were negligible according to independent measurements.
The results presented in this paper were obtained from experiments during 63 days, from January 27 to March 30, 1997. Data from the treated building and control building are compared in Table 1 and Figures 4-9. Table 1 provides the basic statistics of environmental parameters, gas concentrations, gas emission rates and airflow rates during this period of time.
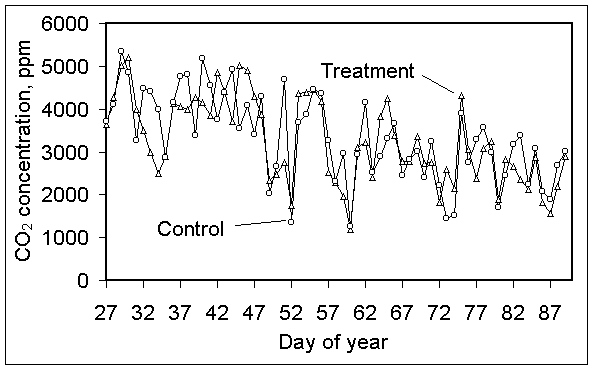
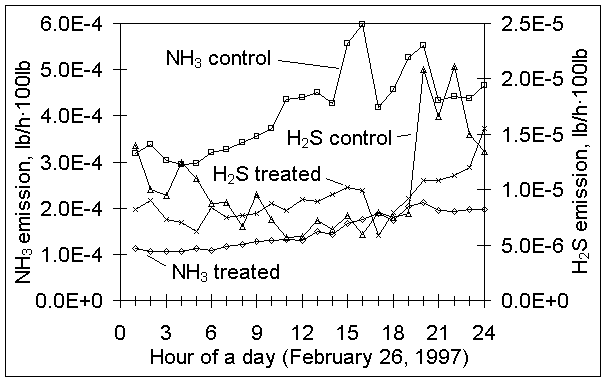
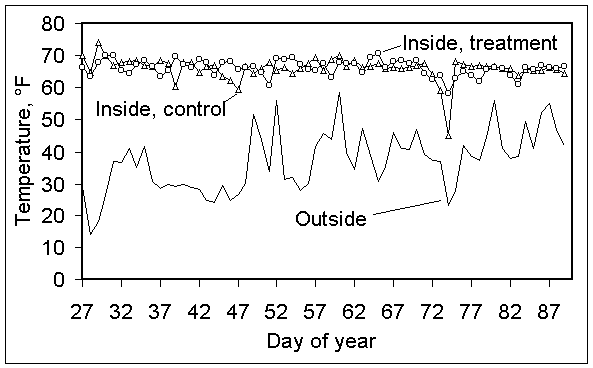
Initially, there were 859 and 927 pigs in the treated and control buildings, respectively. Pig numbers decreased to 394 and 284 on March 30, 1997. Based on linear interpolation between incoming and outgoing weights, the pigs weighed 141 lb at the beginning and 242 lb at the end of experiment (Figure 3). Figures 4, 5 and 6 present the daily mean values of gas concentrations of NH3, H2S and CO2. Figure 7 illustrates the hourly mean emission rates of NH3 and H2S per 100 lb of pig in a typical day. Figures 8 and 9 give the daily mean emission rates of NH3 and H2S per 100 lb of pig during the entire period. Daily averages of inside temperature (at the height of 1'8" above floor) and outside temperature are presented in Figure 10.
Daily mean NH3 concentrations in the pits averaged 4±0.4 and 14.3±1.3 ppm in the treated and control buildings, respectively. Daily mean NH3 concentrations in the chimney averaged 4.3±0.4 and 13.7±1.4 ppm in the treated and control buildings, respectively. The pit/chimney ratios of daily mean NH3 concentrations were 0.93 and 1.04 in the treated and control buildings, respectively. In the treated building, NH3 concentrations were greater in the outlets because the NH3 reducing chemical had greatly reduced the fraction of the total ammonia produced that was from the pit. A greater portion of the total ammonia produced was derived from above the floor as compared to the control room.
Daily mean H2S concentrations in the pits averaged 251±40 and 193±40 ppb in the treated and control buildings, respectively. Daily mean H2S concentrations in the chimney averaged 190±39 and 166±40 ppb in the treated and control buildings, respectively. The pit/chimney ratios of daily mean H2S concentrations were 1.32 and 1.16 in the treated and control buildings, respectively. The reason for higher concentrations in the pits was perhaps due to the relatively high density of hydrogen sulfide.
Daily mean CO2 concentrations in the pits averaged 2884±228 and 3022±223 ppm in the treated and control buildings, respectively. Daily mean CO2 concentrations in the chimney averaged 3249±250 and 3335±255 ppm in the treated and control buildings, respectively. The maximum numbers reported here are biased low because the concentrations frequently exceeded the 5000 ppm range of the CO2 monitors. The pit/chimney ratios of daily mean CO2 concentrations were 0.89 and 0.91 in the treated and control buildings, respectively. Carbon dioxide concentrations were probably higher in the chimney outlets than at the top of the pit headspace because the CO2 generated above the floor from the pigs is greater than that generated from the stored manure (Ni et al., 1996).
The average NH3 emission per pig was 1.45 lb/yr in the treated building as compared to 4.72 lb/yr in the control building. Thus the manure additive appeared to reduce whole house NH3 emissions by 69%.
The average H2S emissions per pig in the treated and control buildings were 0.13 and 0.12 lb/yr, respectively. We expected to observe an increased H2S level as the NH3 decreased because the basic NH3 is known to react with the acidic H2S. That no essential increase in H2S was observed suggests that the manure additive was at least partially effective in controlling the toxic H2S. However, since NH3 production was reduced significantly, the H2S production should have increased. Therefore, the manure additive was effective in counteracting the increased H2S production that theoretically should have occurred. The hourly emission of H2S was more variable than NH3 as seen on February 26 (Figure 7).
The average CO2 emissions per pig in the treated and control buildings were at 2910 and 3089 lb/yr, respectively. The emission from the treated building was 5% lower. The sources of CO2 emission included animal respiration, manure release and combusting heaters. There were two 225 000 Btu/h liquid propane heaters.
Data reported in this paper are the initial results obtained during 63 days at one observation site. A total of four sites are presently being monitored, each for a period of 12 months. The latest data for these tests can be seen on the Purdue Pork Page at http://anr.ces.purdue.edu/porkpage.htm.
According to the data collected in this experiment, producers can expect up to 70% reduction in ammonia gas generation and concentration in their deep-pit finishing buildings with the use of Alliance. The other 30% is probably being emitted from the slats and above the slats which is out of reach of the applied spray. The product did not increase or decrease the hydrogen sulfide generation rate, although 30 to 50% reductions have been measured in more recent tests.
CIGR. 1992. Climatization of Animal Houses. (2nd Ed). Faculty of Agricultural Sciences, State University of Gent, Gent, Belgium, Commission Internationale du Génie Rurale.
Goedseels, V. 1973. De evaluatie van de odorantenemissie in relatie tot de infrastructuur van intensieve veebedrijven. Het Ingenieursblad 42(20):557-564.
Hartung, J., and V.R. Phillips. 1994. Control of gaseous emissions from livestock buildings and manure stores. Journal of Agricultural Engineering Research. 57:173-189.
Muehling, A.J. 1970. Gases and odors from stored swine waste. Journal of Animal Science. 30:526-530.
Ni, J., J. Hendrics, D. Berckmans and C. Vinckier. 1996. Carbon dioxide from pig respiration and from manure in commercial pig house. In: Advances in Agricultural and Biological Environmental Engineering (Eds. S. Zhang and Y. Wang). Proceedings of International Conference on Agricultural and Biological Environment Engineering. Beijing, August 15-19. China Agricultural University Press, Beijing, China. pp. IV28-IV33.

Figure 1. Cross section (top), floor plan (middle) and side view (bottom) of the treated building with sampling and measurement positions.

Figure 2. Configuration of the measurement setup for the treated and control buildings.

Figure 3. Pig numbers and pig weights in the treated and control buildings.

Figure 4. Daily mean NH3 concentrations in the chimney in the treated and control buildings.

Figure 5. Daily mean H2S concentrations in the chimney in the treated and control buildings.

Figure 6. Daily mean CO2 concentrations in the chimney in the treated and control buildings.

Figure 7. Hourly mean NH3 and H2S emissions per 100 lb of pig from the treated and control buildings in a typical day.

Figure 8. Daily mean NH3 emission rates per 100 lb of pig in the treated and control buildings.

Figure 9. Daily mean H2S emission rates per 100 lb of pig in the treated and control buildings.

Figure 10. Change of inside and outside temperatures.
Table 1. Statistics for daily means of environmental parameters, gas concentrations, gas emission rates and airflow rates from January 27 to March 31, 1997 (95% confidence levels are shown as ± 2 standard errors).
|
Treated building |
Control building |
||||
|---|---|---|---|---|---|---|
Parameter |
Mean |
Min. |
Max. |
Mean |
Min. |
Max. |
Temperature - Outside, °F |
37±2.4 |
14.0 |
58.5 |
37±2.4 |
14.0 |
58.5 |
Temperature - Attic, °F |
39±2.3 |
17.4 |
60.4 |
40±2.3 |
17.4 |
60.2 |
Temperature - 1'8" above floor, °F |
66.2±0.6 |
58.2 |
70.6 |
66.1±0.9 |
45.2 |
74.1 |
Temperature - 4'11" above floor, °F |
65.3±0.5 |
55.9 |
68.4 |
65.5±1 |
43.8 |
73.3 |
Temperature - Chimney outlet, °F |
65.7±0.8 |
54.2 |
70.1 |
66.3±1.1 |
41.4 |
71.8 |
Relative humidity - Inside, % |
76±3 |
58 |
95 |
67±2 |
52 |
87 |
Relative humidity - Outside, % |
79±3 |
53 |
98 |
79±3 |
53 |
98 |
Pressure difference, Pa |
-4.8±1 |
-19 |
0 |
-3±1 |
-17 |
3 |
NH3 concentration - in pit, ppm |
4±0.4 |
1.3 |
11.8 |
14.3±1.3 |
3.6 |
26.5 |
NH3 concentration - in chimney, ppm |
4.3±0.4 |
1.3 |
10.3 |
13.7±1.4 |
3.7 |
25.9 |
H2S concentration - in pit, ppb |
251±40 |
23 |
1079 |
193±40 |
45 |
1150 |
H2S concentration - in chimney, ppb |
190±39 |
55 |
1081 |
166±40 |
23 |
1140 |
CO2 concentration - in pit, ppm |
2884±228 |
776 |
4702 |
3022±223 |
1319 |
5344 |
CO2 concentration - in chimney, ppm |
3249±250 |
1201 |
5211 |
3335±255 |
1251 |
5350 |
Gas emission rates - NH3, lb/yr·pig |
1.45±0.18 |
0.44 |
4.59 |
4.72±0.63 |
0.21 |
15.22 |
Gas emission rates - H2S, lb/yr·pig |
0.13±0.02 |
0.01 |
0.44 |
0.12±0.02 |
0.01 |
0.42 |
Gas emission rates - CO2, lb/yr·pig |
2910±249 |
1452 |
7301 |
3089±252 |
1216 |
6264 |
Airflow rates, ft3/h·pig |
1056±179 |
330 |
3872 |
1091±180 |
227 |
3438 |
Index of 1997 Purdue Swine Day Articles
If you have trouble accessing this page because of a disability, please email anscweb@purdue.edu.