Purdue University 1998 Swine Day Report
M.T. Leininger, C.P. Portocarrero, C.A. Bidwell, M.E.
Spurlock, J.N. Nielsen, and K.L. Houseknecht
Department of Animal Sciences and Purina Mills
There is a significant economic incentive for pork producers to increase the efficiency of lean pork production. Environmental and disease stresses impose detrimental effects on food intake, lean muscle growth, and overall animal health. Even minimal immune challenges such as modified live vaccines may slow growth rate and feed intake. Furthermore, genetic lines of pigs selected for high rates of lean gain appear to be more susceptible to the detrimental effects of stress on animal performance (Frank et al., 1997). Thus it is important to identify genes which predispose animals to stress and disease, and to subsequently develop management strategies which minimize the impact of environmental and disease stressors on animal growth and well being.
A gene that may be important in the regulation of feed intake and energy metabolism during disease stress is leptin. Leptin is a protein that is made by and secreted from fat cells (Pelleymounter et al., 1995; Halaas et al., 1995; Campfield et al., 1995; Houseknecht et al., 1996). Leptin works at the level of the brain to regulate food intake and energy expenditure in rodents and humans (Houseknecht et al., 1998). In rodents, an immune challenge causes leptin levels to rise, which sends a strong signal to the brain to stop eating and results in anorexia (Grunfeld et al., 1996; Sarraf et al., 1997). Pigs produce leptin (Bidwell et al., 1997), and it is possible that leptin concentrations change with stress or disease and may be important in regulating feed intake, growth rate and recovery from disease stress.
Eighteen Pietrain x Gene Packer (HLG, Creighton Brothers, Mentone, IN), 18 Yorkshire x Landrace terminal cross (MLG, Purdue Research Center), and 9 Yorkshire x Landrace maternal line (LLG, Purdue Research Center) barrows were segregated early weaned (SEW) and reared using an all-in, all-out system. Growth rate was measured every 2 weeks throughout the trial. At 180 to 220 lb, 10th rib backfat measurements were determined by ultrasound.
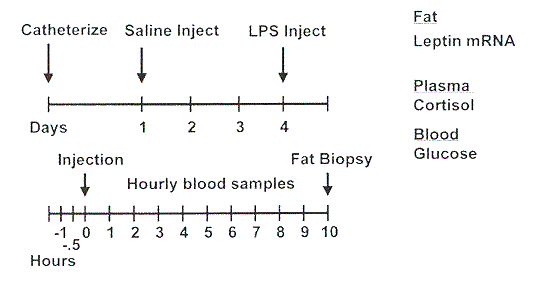
The experimental design employed in this experiment is illustrated in Figure 1. Each pig served as its own control. To facilitate frequent blood sampling, a catheter was surgically inserted into the jugular vein of each pig. Following a 3-day recovery from surgery, all pigs were injected with saline for the control treatment. Three days later, an injection of lipopolysaccharide (LPS, 25 mg/kg BW of E. coli serotype 055:B5) was administered. LPS activates the immune system and induces sepsis. Blood samples were collected frequently during each treatment period for determination of glucose and cortisol concentrations. Blood glucose concentrations were immediately determined using a Lifescan glucose meter. Plasma cortisol concentrations were measured using a radioimmunoassay kit. Rectal temperatures were recorded hourly. Following the final blood sampling, pigs were anesthetized and a 3 to 4 gram sample of subcutaneous adipose tissue was extracted from the neck and frozen in liquid nitrogen until later analysis of leptin gene expression. Total RNA was extracted from adipose tissue, and leptin abundance was determined by RNase Protection Assay.
Growth Parameters
The effect of genotype on average daily gain is shown in Figure 2. With the exception of the 8 to 12 week period, HLG pigs showed higher growth rates than MLG or LLG pigs. Subcutaneous 10th rib backfat thickness at 180 to 220 lb (Figure 3) was also significantly lower in the HLG barrows compared to the LLG barrows, indicative of lower body fat content.
Clinical Response to LPS Challenge
Body temperatures were higher in HLG pigs than in MLG and LLG pigs during the control period (Figure 4). These differences between HLG and MLG were highly significant (P<.006), and were likely due to a higher metabolic rate in the HLG line. In response to LPS, body temperatures were significantly elevated in all pigs studied. Immediately following LPS injection, body temperatures were higher in the LLG pigs compared to HLG pigs (P<.05). However, at all other time points, there was no effect of genotype on LPS-induced elevation in body temperatures (P>.05).
Cortisol, a hormone induced by stress, acts to partition nutrients away from muscle and adipose tissue to allow the animal to cope with disease stress. LPS significantly increased cortisol concentrations in the three genetic lines (Figure 5). With the exception of one time point, there was no significant difference between genotypes in cortisol concentrations following the saline or LPS injection. LPS injection also caused a reduction in glucose concentration in all three lines compared to basal concentrations (Figure 6). This reduction was much more profound in the LLG pigs (P<.05). The reduction in blood glucose that occurs following an immune challenge in rodents has been attributed to a decrease in glucose production and output by the liver, and an increase in glucose uptake by tissues containing high numbers of immune cells. One study found higher glucose uptake in tissues of rats with increased tolerance to an LPS challenge (Spolarics and Spitzer, 1995). It is possible that the greater reduction in blood glucose concentrations in the LLG pigs is due to a higher level of glucose uptake into peripheral tissues, making this line more tolerant to the LPS injection. Other researchers have obtained similar reductions in blood glucose concentrations using slightly lighter pigs (130 to 200 lb) and a slightly lower dose of LPS (20 mg/kg BW). In these pigs, blood glucose concentrations decreased between 2 and 4 hours after the challenge (Myers et al., 1997).
Leptin Response
Leptin was originally cloned in mice, and the porcine leptin gene was cloned by Bidwell et al. (1997). Administration of leptin to mice which are unable to produce the hormone causes drastic reductions in body weight and food intake, and increases in metabolic rate and physical activity (Houseknecht et al., 1998). In our study, leptin expression at 10 hours following the LPS injection was greatly reduced compared to basal levels (Figure 7). This is the opposite of what was seen in mice and hamsters, where leptin expression was increased following an LPS challenge (Grunfeld et al., 1996; Sarraf et al., 1997). Adipose tissue extracted from LPS-challenged mice showed a dose dependent increase in leptin expression at 5 hours (Sarraf et al., 1997). Our data most likely reflect species differences between the pig and mouse, as LPS has no effect on leptin expression in pigs at earlier time points relative to LPS injection (M.E. Spurlock, personal communication). Considering leptin's ability to inhibit food intake, this drop in leptin expression could be a mechanism by which the pig recovers and starts eating again. It is interesting to note that this drop in leptin expression appeared to be more extreme in the MLG and LLG pigs as compared to the HLG pigs, although the difference was not statistically significant (Figure 8).
We have observed a difference in response in LPS-induced glucose concentrations between genotypes. These genotype effects seem to parallel the difference in LPS-induced reduction in leptin expression between the genotypes. This makes sense when we consider the recent suggestion that glucose may regulate leptin expression. This reduction in glucose therefore may prove to be beneficial to the pig by reducing leptin levels, thus sending an important signal to eat, which may help the pig recover from sickness.
Further studies employing treatment regimens that reduce leptin expression (and thus stimulate feed intake) could aid in the recovery from or resistance to the negative side effects of immune challenge on food intake and growth. These studies may be especially important for lean genotype pigs, which are more susceptible to detrimental effects of environmental stress on performance and viability.
Bidwell, C.A., S. Ji, G.R. Frank, S.G. Cornelius, G.M. Willis, and M.E. Spurlock. 1997. Cloning and expression of the porcine obese gene. Animal Biotechnology 8(2):191-206.
Campfield, L.A., F.J. Smith, Y. Guisez, R. Devos, and P. Burn. 1995. Recombinant mouse OB protein: evidence for a peripheral signal linking adiposity and central neural networks. Science 269: 546-549.
Frank, J.W., B.T. Richert, A.P. Schinckel, B.A. Belstra, and A.L. Grant. 1997. Environmental effects on genetic potential for lean gain. Journal of Animal Science 75(Suppl. 1):38.
Grunfeld, C., C. Zhao, J. Fuller, A. Pollock, A. Moser, J. Friedman, and K.R. Feingold. 1996. Endotoxin and cytokines induced expression of leptin, the ob gene product in hamsters. The Journal of Clinical Investigation 97:2152-2157.
Halaas, J.L., K.S. Gajiwala, M. Maffei, S.L. Cohen, B.T. Chait, D. Rabinowitz, R.L. Lallone, S.K. Burley, and J.M. Friedman. 1995. Weight-reducing effects of the plasma protein encoded by the obese gene. Science 269:543-546.
Houseknecht, K.L., C.A. Baile, R.L. Matteri, and M.E. Spurlock. 1998. The biology of leptin: A review. Journal of Animal Science 76:1405-1420.
Houseknecht, K.L., S.N. Flier, E.U. Frevert, R.C. Frederich, J.S. Flier, and B.B. Kahn. 1996. Leptin secretion correlates with adipocyte size in genetic and dietary obesity. Diabetes 45(Suppl. 2):41A.
Myers, M.J., D.E. Farrell, C.M. Evockclover, M.W. Mcdonald, and N.C. Steele. 1997. Effect of growth hormone of chromium picolinate on swine metabolism and inflammatory cytokine production after endotoxin challenge exposure. American Journal of Veterinary Research. 58(6):594-600.
Pelleymounter, M.A., M.J. Cullen, and M.B. Baker. 1995. Effects of the obese gene product on body weight regulation in ob/ob mice. Science 269: 540-543.
Sarraf, P., R.C. Frederich, E.M. Turner, G. Ma, N.T. Jaskowiak, D.J. Rivert III, J.S. Flier, B.B. Lowell, D.L. Fraker, and H.R. Alexander. 1997. Multiple cytokines and acute inflammation raise mouse leptin levels: Potential role in inflammatory anorexia. The Journal of Experimental Medicine 185:171-175.
Spolarics, Z., and J.J. Spitzer. 1995. Acute endotoxin tolerance is accompanied by stimulated glucose use in macrophage rich tissues. Biochemical and Biophysical Research Communications 211:340-346.

Figure 1. Scheme for the experimental design.
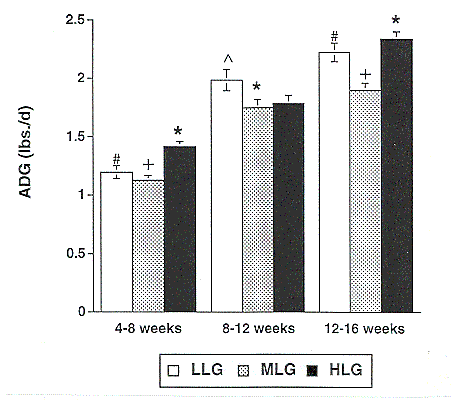
Figure 2. Effect of genotype on average daily gain in low lean gain (LLG), moderate lean gain (MLG), and high lean gain (HLG) barrows. (* vs. + P<.0001; * vs. # P<.003; ^ vs. * P<.05)
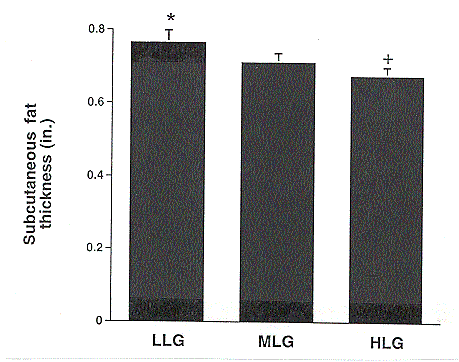
Figure 3. Effect of genotype on weight-adjusted 10th rib backfat thickness in low lean gain (LLG), moderate lean gain (MLG), and high lean gain (HLG) barrows. Measurements were taken one week prior to the LPS study (180 to 220 lb body weight). (* vs. + P<.04)
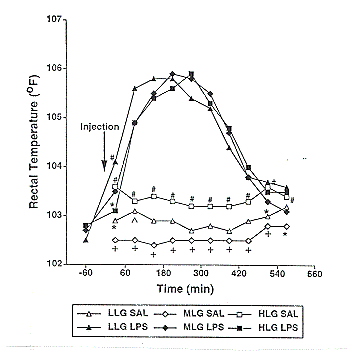
Figure 4. Effect of saline (SAL) or lipopolysaccharide (LPS) on rectal temperature of low lean gain (LLG), moderate lean gain (MLG), and high lean gain (HLG) barrows. Within treatment pooled SEM were 0.1 for saline and 0.27 for LPS. (# vs. + P<.006; # vs. * P<.05; ^ vs. + P<.03)
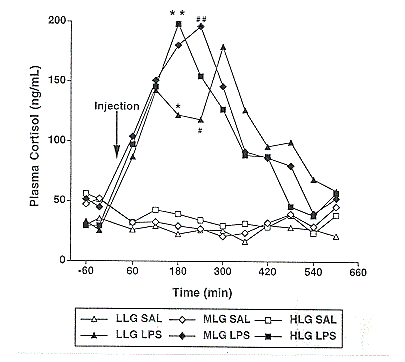
Figure 5. Effect of saline (SAL) or lipopolysaccharide (LPS) on plasma cortisol concentrations in low lean gain (LLG), moderate lean gain (MLG), and high lean gain (HLG) genotypes. Pooled SEM was 20 ng/mL. (# vs. ## P<.05; * vs. ** P<.07)
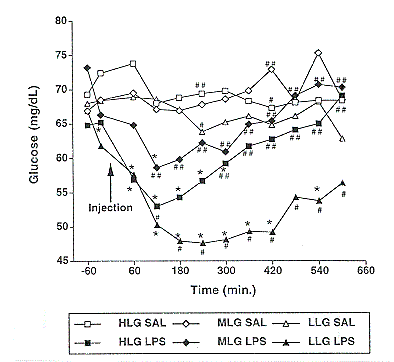
Figure 6. Effect of saline (SAL) or lipopolysaccharide (LPS) on blood glucose concentrations in low lean gain (LLG), moderate lean gain (MLG), and high lean gain (HLG) barrows. Pooled SEM was 2.5 mg/dL. (* represents significant difference from saline level at P<.05; # vs. ## represents significant difference between genotypes within a treatment at P<.05)
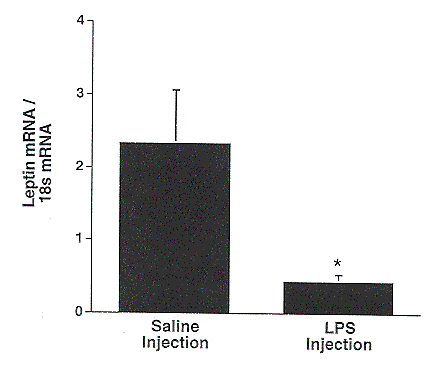
Figure 7. Effect of lipopolysaccharide (LPS) challenge on leptin mRNA abundance in porcine subcutaneous adipose tissue. (* P<.05)
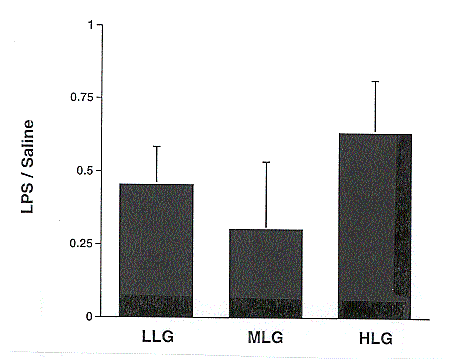
Figure 8. Effect of lipopolysaccharide (LPS) challenge on leptin mRNA abundance in porcine subcutaneous adipose tissue for low lean gain (LLG), moderate lean gain (MLG), and high lean gain (HLG) barrows (P>.05).
Index of 1998 Purdue Swine Day Articles
If you have trouble accessing this page because of a disability, please email anscweb@purdue.edu.