Purdue University 1998 Swine Day Report
J.M. Eggert, B.A. Belstra, B.T. Richert, and A.P.
Schinckel
Department of Animal Sciences
Modern gilt genotypes often reach puberty and conceive their first litter before their body reserves (muscle and fat) have matured. This lack of body reserves at breeding can result in extended wean to estrus intervals and decreased conception rates in parity 1, and reduced litter size in parity 2 (Mullan and Williams, 1989). Under-developed body reserves at breeding may also compromise sow longevity, as many gilts are culled from the breeding herd for locomotion or reproductive problems (Dourman et al., 1994; Rozeboom et al., 1996).
Gestation is the only phase of production during which sows can replenish lost body reserves. The amounts of energy and protein supplied to the sow during gestation are the limiting factors in the development of body reserves (Dourmad et al., 1996). Development of fat reserves during gestation is necessary for satisfactory reproductive performance, but excessive fat deposition can have negative effects on reproduction. It is well established that high levels of body fat deposition during gestation can decrease feed intake during lactation (Revell et al., 1994; Weldon et al., 1994). However, body fat reserves are necessary for adequate milk production and to limit body weight loss during lactation (Ranford et al., 1994). Thus, there is an optimal range of backfat that is necessary to sustain reproduction.
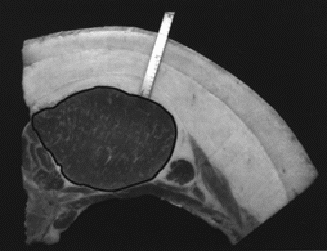
Over the past three years, we have observed that pig genotypes differ not only in the total amount of backfat, but also in the relative amounts of the three individual backfat layers - outer, middle and inner (Figure 1). While it is apparent from carcass evaluations that these layers differ in chemical, structural and textural properties, their relative contributions to growth and physiology in the live animal remain unknown. At the present time, we are analyzing the growth of individual backfat layers in market hogs, and further characterizing each layer in terms of cellularity, fatty acid composition and gene expression. This trial is a preliminary investigation of how the energy demands of gestation and lactation affect growth and depletion of individual backfat layers. Preliminary data from other trials indicate that consideration of these layers to be three separate tissues may enhance pork quality and carcass composition. We are currently investigating whether such a consideration could enhance reproductive management as well. Monitoring backfat development may provide an insight into relationships between individual fat layers and reproductive traits.
The main objective of this study was to monitor changes in both total 10th rib backfat depth and individual backfat layer thickness during gestation and lactation. We also wanted to relate these changes in total backfat and backfat layers to gestational dietary treatments, reproductive performance during the subsequent lactation, and sire line of the litter.
Forty-five lean European gilts (1/2 Landrace, 1/4 Large White, 1/4 Duroc) were housed in an open-front unit in 8'x 44' pens (22' outside and 22' under roof) in groups of 7 to 8 with fence line contact to a mature boar. Gilts were checked for heat twice daily and were bred via AI at their second or third estrus in the presence of a mature boar. Gilts were randomly bred to one of three lean European sire lines (Low, Medium and High % Lean), and were approximately 250 days old and 330 lb liveweight at breeding.
All gilts received 4.4 lb/day of a 13.3% crude protein (CP), 0.6% lysine diet until day 40 of gestation, when they were allotted by weight to one of three dietary treatments. Treatment 1 (CONTROL) remained on the basal diet (13.3% CP, 0.6% lysine) and feeding level (4.4 lb/day) throughout gestation. Treatment 2 (2-Step CP) was stepped up in dietary CP at day 40 to a 14.6% CP, 0.7% lysine diet, and at day 80 to a 16% CP, 0.8% lysine diet, both fed at 4.4 lb/day. Treatment 3 (1-Step CP+E) was stepped up at day 80 of gestation in both CP and energy by increasing the feed intake of the basal diet from 4.4 to 6.0 lb/day. All diets were formulated to meet or exceed NRC (1988) nutrient requirements for breeding gilts. Each gilt's gestation dietary treatment was continued until farrowing. Gilts were then given ad-libitum access to a 16% CP, 0.8% lysine lactation diet the day after farrowing.
Gilt weight and 10th rib backfat depth were measured on days 10, 80 and 110 of gestation and days 2 and 14 of lactation. An Aloka 210 ultrasound machine fitted with a 3.5 mHz linear probe was utilized for backfat measurements. Sows and their litters were weighed on days 2 and 14.
Gestation
The effects of the dietary treatments on backfat growth during gestation are presented in Table 1. There were no differences in total or individual backfat layer thickness at day 80 of gestation, but gilts fed the CONTROL diet tended to have less fat at each layer. At day 110 of gestation, gilts fed 1-Step CP+E had significantly more inner layer backfat. All dietary treatment groups increased total backfat from days 80 to 110 of gestation, but CONTROL-fed gilts lost weight during this period while gilts fed 1-Step CP+E gained weight. Trends for the changes in total and individual backfat layer thickness during gestation are presented in Figure 2 (between diets) and Figure 3 (between layers). There were no significant effects of sire line of the litter on backfat during gestation.
Lactation
The effects of sire line of the litter on backfat growth during late gestation and lactation are presented in Table 2. Low % Lean-sired litters tended to have larger litter size and litter weight. There were no significant differences in total or individual backfat layer thickness at either gestation day 80 or lactation day 14 for sows bred to sires of different lines. However, sows with Medium % Lean-sired litters tended to mobilize the least amount of backfat, as their inner layer increased in thickness during lactation, while sows bred to the other sire lines showed a decrease in inner layer backfat. Sows with Low % Lean-sired litters tended to lose the most weight throughout lactation. Trends for the changes in total and individual backfat layer thickness during late gestation and lactation are presented in Figure 4 (between sires) and Figure 5 (between layers). There were no significant effects of dietary treatment on backfat during late gestation and lactation.
Most notable from these results is the layer-specific changes in backfat thickness during lactation. Our other studies of individual backfat growth indicate that the outer layer tends to be deposited first, followed by the middle and then the inner layer. Therefore, we hypothesized that during periods of negative energy balance, mobilization of fat would occur in the reverse order. However, during lactation, when the sow is losing weight and mobilizing fat, the middle layer of backfat was consistently found to be increasing in thickness while the outer layer decreased and the inner layer remained largely unchanged. These results indicate that a sow's energy status may be better described by considering changes in individual backfat layer thickness rather than just total backfat.
Backfat is a critical energy source for the sow during periods of negative energy balance, but the relative contributions of each layer as a source of energy appear to differ. Genes that are expressed in adipose tissue are believed to regulate both feed intake and whole-body energy metabolism. Should the expression of such genes also be determined to be layer-specific, their effects on reproductive performance may be better defined. While not always statistically significant, differences between the growth of individual backfat layers during gestation and lactation are apparent. The results of this preliminary trial indicate that future research on the role of backfat in reproduction should be layer-specific. Further efforts will consider the effects of divergent genotypes of gilts and sires, and longer lactation periods.
Dourmad, J.Y., M. Etienne, and J. Noblet. 1996. Reconstitution of body reserves in multiparous sows during pregnancy: Effect of energy intake during pregnancy and mobilization during the previous lactation. J. Anim. Sci. 74:2211-2219.
Dourmad, J.Y., M. Etienne, A. Prunier, and J. Noblet. 1994. The effect of energy and protein intake of sows on their longevity: A review. Livest. Prod. Sci. 40:87-97.
Mullan, B.P., and I.H. Williams. 1989. The effect of body reserves at farrowing on the reproductive performance of first-litters sows. Anim. Prod. 48:449-457.
Ranford, J.L., D.K. Revell, B.P. Mullan, I.H. Williams, and J.K. Toussaint. 1994. Milk yield, but not milk composition, may be influenced by body fatness in primiparous sows. J. Anim. Sci. Abstract 72(Suppl. 1):389.
Revell, D.K., I.H. Williams, B.P. Mullan, and R.J. Smits. 1994. Body fatness influences voluntary feed intake and live weight loss during lactation in primiparous sows. J. Anim. Sci. Abstract 72(Suppl. 1):389.
Rozeboom, D.W., J.E. Pettigrew, R.L. Moser, S.G. Cornelius, and S.M. El Kandelgy. 1996. Influence of gilt age and body composition at first breeding on sow reproductive performance and longevity. J. Anim. Sci. 74:138-150.
Weldon, W.C., A.J. Lewis, G.F. Louis, J.L. Kovar, M.A. Giesemann, and P.S. Miller. 1994. Postpartum hypophagia in primiparous sows: I. Effects of gestation feeding level on feed intake, feeding behavior, and plasma metabolite concentrations during lactation. J. Anim. Sci. 72:387-394.

Figure 1. Total 10th rib backfat and individual backfat layers.
Table 1. Effect of dietary treatment on change in total 10th rib backfat, individual backfat layers, and sow weight during gestation.
|
Dietary Treatment |
|
|
||
|---|---|---|---|---|---|
Item |
CONTROL |
2-Step CP |
1-Step CP+E |
SE |
Sig.* |
|
|
|
|
|
|
Total Backfat (in.) |
0.87 |
0.93 |
0.96 |
0.04 |
Not sig. |
Outer Layer (in.) |
0.37 |
0.43 |
0.43 |
0.02 |
Not sig. |
Middle Layer (in.) |
0.24 |
0.31 |
0.29 |
0.03 |
Not sig. |
Inner Layer (in.) |
0.19 |
0.21 |
0.22 |
0.02 |
Not sig. |
Sow Weight (lb) |
418.5 |
417.2 |
417.6 |
6.64 |
Not sig. |
|
|
|
|
|
|
Total Backfat (in.) |
0.97 |
0.99 |
1.05 |
0.05 |
Not sig. |
Outer Layer (in.) |
0.43 |
0.48 |
0.46 |
0.03 |
Not sig. |
Middle Layer (in.) |
0.24 |
0.29 |
0.29 |
0.03 |
Not sig. |
Inner Layer (in.) |
0.24 |
0.23 |
0.28 |
0.02 |
P<.05 |
Sow Weight (lb) |
446.5 |
455.8 |
459.3 |
9.75 |
Not sig. |
|
|
|
|
|
|
D Total Backfat (in.) |
+ 0.09 |
+ 0.07 |
+ 0.09 |
0.08 |
Not sig. |
D Outer Layer (in.) |
+ 0.04 |
+ 0.06 |
+ 0.04 |
0.06 |
Not sig. |
D Middle Layer (in.) |
+ 0.00 |
- 0.01 |
- 0.00 |
0.06 |
Not sig. |
D Inner Layer (in.) |
+ 0.04 |
+ 0.02 |
+ 0.06 |
0.05 |
Not sig. |
D Sow Weight (lbs.) |
- 8.8 |
- 0.2 |
+ 5.7 |
3.92 |
P<.05 |
|
|
|
|
|
|
D Total Backfat (in.) |
+ 0.28 |
+ 0.25 |
+ 0.32 |
0.11 |
Not sig. |
D Sow Weight (lb) |
+ 68.6 |
+ 74.5 |
+ 78.3 |
3.84 |
Not sig. |
*Not sig. = not significant, P>.05.
Table 2. Effect of sire line on change in total 10th rib backfat, individual backfat layers, and sow weight during late gestation and lactation.
|
Sire Line of the Litter |
|
|
||
|---|---|---|---|---|---|
Item |
Low % Lean | Medium % Lean | High % Lean | SE | Sig.* |
|
|
|
|
|
|
Total Backfat (in.) |
0.99 |
0.98 |
1.05 |
0.04 |
Not sig. |
Outer Layer (in.) |
0.46 |
0.44 |
0.46 |
0.03 |
Not sig. |
Middle Layer (in.) |
0.28 |
0.28 |
0.28 |
0.03 |
Not sig. |
Inner Layer (in.) |
0.26 |
0.24 |
0.26 |
0.02 |
Not sig. |
Sow Weight (lb) |
456.9 |
453.9 |
447.5 |
9.97 |
Not sig. |
|
|
|
|
|
|
Litter Weight (lb) |
47.1 |
39.0 |
39.4 |
2.76 |
P<.10 |
Number Born |
11.83 |
10.19 |
10.72 |
0.92 |
Not sig. |
|
|
|
|
|
|
Total Backfat (in.) |
0.94 |
0.93 |
1.00 |
0.06 |
Not sig. |
Outer Layer (in.) |
0.39 |
0.37 |
0.39 |
0.02 |
Not sig. |
Middle Layer (in.) |
0.32 |
0.30 |
0.35 |
0.03 |
Not sig. |
Inner Layer (in.) |
0.24 |
0.26 |
0.26 |
0.02 |
Not sig. |
Sow Weight (lb) |
419.2 |
405.9 |
395.8 |
12.02 |
Not sig. |
Litter Weight (lb) |
71.2 |
77.3 |
81.9 |
5.25 |
Not sig. |
No. of Pigs Weaned |
8.10 |
8.25 |
9.45 |
0.51 |
Not sig. |
|
|
|
|
|
|
D Total Backfat (in.) |
- 0.06 |
- 0.04 |
- 0.05 |
0.04 |
Not sig. |
D Outer Layer (in.) |
- 0.09 |
- 0.05 |
- 0.06 |
0.02 |
Not sig. |
D Middle Layer (in.) |
+ 0.04 |
+ 0.05 |
+ 0.06 |
0.03 |
Not sig. |
D Inner Layer (in.) |
- 0.02 |
+ 0.05 |
- 0.01 |
0.02 |
P<.05 |
D Sow Weight (lb) |
- 59.5 |
- 38.8 |
- 32.0 |
10.58 |
Not sig. |
*Not sig. = not significant, P>.05.
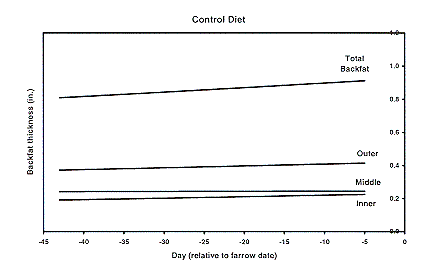
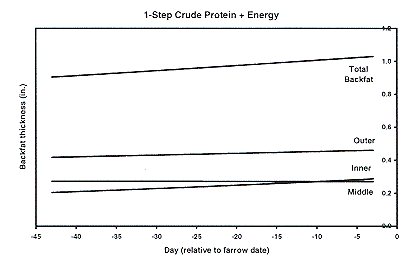
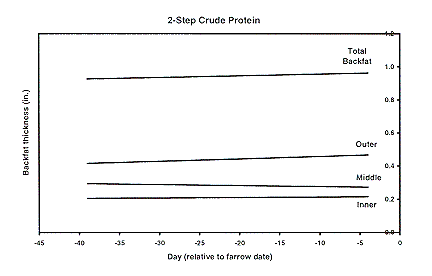
Figure 2. Effects of dietary treatment on changes in backfat during gestation.
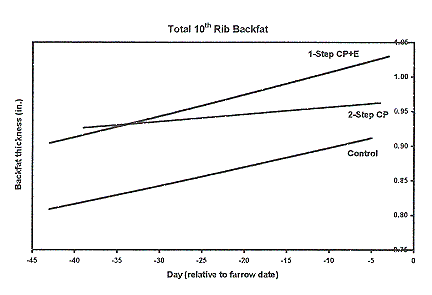
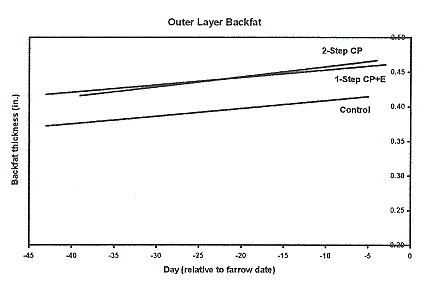
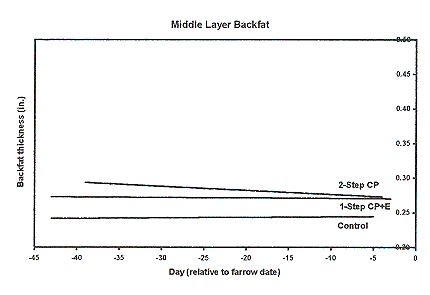
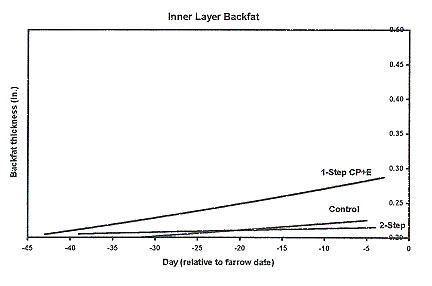
Figure 3. Across-diet comparison of changes in total and individual backfat layers during gestation.
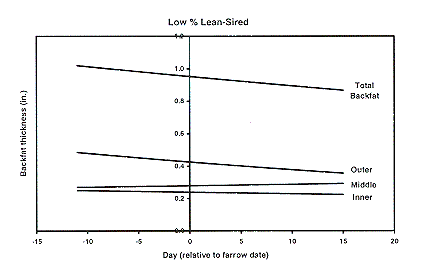
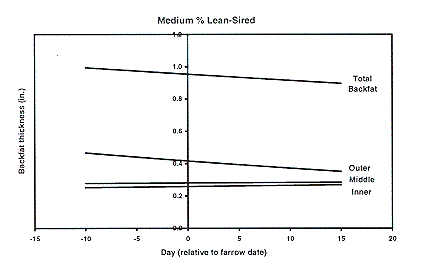
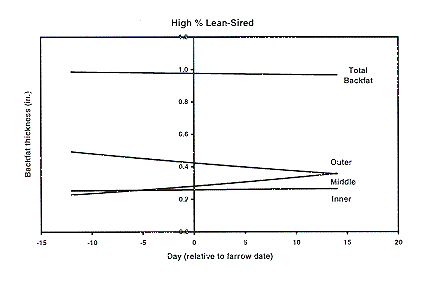
Figure 4. Effects of sire line of the litter on changes in backfat during lactation.
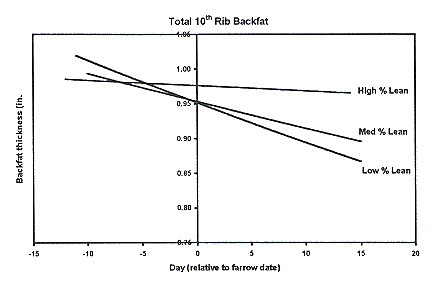
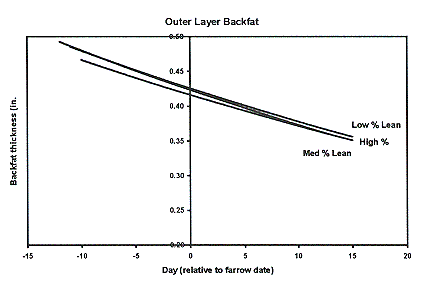
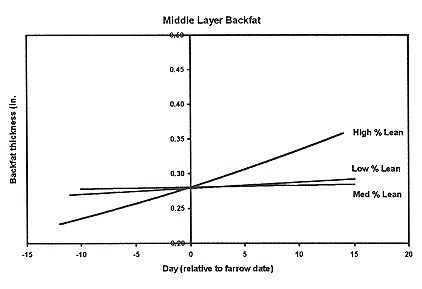
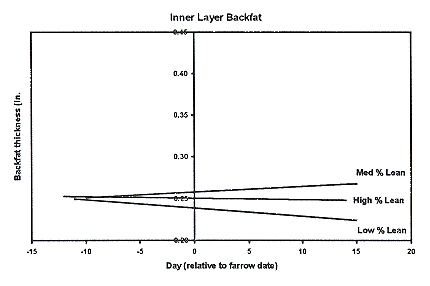
Figure 5. Across-sire comparison of changes in total and individual backfat layers during lactation.
Index of 1998 Purdue Swine Day Articles
If you have trouble accessing this page because of a disability, please email anscweb@purdue.edu.