Purdue University 1998 Swine Day Report
Sampling Errors Associated with Protein Accretion and Amino
Acid Requirements Predicted from Serial Live Weight and Real-Time Ultrasound
Measurements
A.P. Schinckel, J.W. Smith, M.D. Tokach, M.E. Einstein, J.L.
Nielsen, and R.D. Goodband
Department of Animal Sciences, Purdue University and Kansas State University
Currently, swine nutritionists formulate diets based upon estimates of lean
accretion or protein requirements in controlled university or private research
facilities. However, these dietary recommendations may not be correct because of
farm-to-farm differences, environmental conditions, health status, stocking
density, air quality, social factors and other factors. Methods have been
developed in which farm-specific protein accretion curves and daily lysine
requirements can be estimated.
The technique has been used in numerous farms with different genetics. In
most cases, 32 to 40 barrows and gilts have been weighed and ultrasonically
measured every three weeks from 50 to 250 lb live weight. The objective of this
research was to evaluate the precision of the protein accretion curves and
lysine requirements by quantifying the sampling errors associated with the
growth and predicted nutrient requirement curves.
Procedures
Eighty pigs (40 barrows and 40 gilts) on two commercial farms were used.
Pigs were tagged, weighed, and scanned within one week of placement in a
finishing facility. Subsequently, pigs were weighed and scanned every three
weeks until all pigs in the facility were marketed.
Live weight and real-time ultrasound data were used to determine growth,
protein, and lipid accretion curves based on prediction equations developed at
Purdue University. Different equations were used to predict body composition at
different weight ranges: 45 to 65, 65 to 90, 90 to 110, 110 to 170, 170 to 220,
and 220 to 300 lb. Live weight mass (WT) was fit as a function of age (t) using
Bridges  and generalized non-linear
 functions, where WTM is an estimate of mature live weight. Empty-body protein
mass (EBP) was fit as a function of live weight (X) by allometric
(EBP = aXb), augmented allometric
 ,
and generalized non-linear
 functions,
where MTP is an estimate of mature protein mass. Empty-body lipid mass (EBL) was
fit to allometric (EBL = aXb), augmented allometric
 , and
exponential
 functions
of live weight (X). The Residual Standard Deviation (RSD) was calculated by the equation
 where
ei is the residual value for the ith observation, n is the
number of observations, and p is the degrees of freedom for the model. For the
vast majority of cases, the generalized non-linear function resulted in the
smallest RSD values for live weight and EPB; as a result these equations were
used for all curves.
Daily live weight gain and percentage protein and lipid accretion relative to
live weight gain were determined as the derivative of each function. Daily live
weight growth rate was determined as ADG = δWT/δt, where t is the age
in days. Daily protein and lipid accretion rates were determined by
δC/δt = [(δC/δWT) x (δWT/δt)],
where C is the component (protein or lipid). Metabolizable energy (ME)
requirement curves were determined by the following equation: ME =
(.4 x Empty Body Protein Mass.78, kg) + (10.93 x Protein Accretion,
kg/day) + (12.64 x Lipid Accretion, kg/day). Metabolizable energy requirements
were divided by the energy content of the diet (3300 kcal/lb or 1500 kcal/kg) to
determine the estimated daily feed requirement.
Lysine requirements for each gender of pig on each farm were determined by
estimating the maintenance lysine requirement and the lysine requirement for
lean growth.
Maintenance lysine requirement was estimated by: Maintenance Lysine
Requirement = .036 x Body Weight.75 (kg).
Lysine requirement for lean gain was estimated by: Lysine Requirement for
Lean Gain = (.066 x daily protein accretion, g/day) ÷ .65, where .066 is
the lysine content of muscle, and .65 is the efficiency of lysine utilization.
Total lysine requirement was determined by: Total Lysine Requirement =
(Maintenance Lysine Requirement + Lysine Requirement for Lean Gain) ÷ .80,
where .80 is the digestibility of lysine.
Bootstrapping procedures were used to obtain the standard errors of the
growth curves and predicted lysine requirement values. The residual values of
each original observation were randomly assigned to different observations and
the new simulated dataset was reanalyzed. The procedure was repeated 100 times,
such that 100 protein accretion, lipid accretion, predicted energy intake, and
predicted daily lysine requirement curves were produced. The standard errors of
each predicted value were estimated as the standard deviation of the predicted
values at each day of growth.
Results and Discussion
Growth rates were greater for pigs on Farm 1 than pigs on Farm 2 (Figure
1). As expected, barrows grew faster than gilts on the respective farms. The
most striking observation was the drastic decrease in growth rate of the barrows
after reaching a peak of 2 lb/day at 145 lb body weight. The average daily gain
is almost constant from 100 to 220 lb live weight for the gilts.
Body component growth predicted from real-time ultrasound measurements is
presented as empty body protein and empty body lipid accretion. The protein
accretion curves (Figure 2) are similar to the average daily gain curves. The
barrows and gilts of Farm 1 achieved their maximum protein accretion rates at
heavier live weights than the barrows and gilts of Farm 2. Although the
predicted growth rate of the Farm 1 barrows drops below that of the Farm 2
barrows, the Farm 1 barrows maintained higher protein accretion rates. This was
likely due to the Farm 1 barrows maintaining a higher percentage protein
relative to live weight growth at the heavier weights. The shape of the two
barrow protein accretion curves is similar; however, protein gain for gilts
differed on the two farms.
Lipid accretion (Figure 3) increased for all pigs as weight increased. The
lipid accretion of the barrows from Farm 1 marginally increased after 180 lb
live weight. These barrows had a dramatically decreased growth rate during this
period. This discrepancy was caused by the fact that although the live weight
gain decreased, the percentage of lipid in the live weight gain increased, such
that daily lipid growth (the product of average daily gain times percent lipid)
increased. The barrows from Farm 2, in addition to having the lowest protein
deposition rate, had the greatest lipid accretion rate.
The estimated daily energy requirements (Figure 4) were determined from the
daily protein and lipid accretion rates and body composition of the pigs.
Estimated daily energy requirements increased as the weight of the pigs
increased. This estimated daily energy requirement is the estimated energy
needed to sustain the pig's maintained growth. The daily feed energy intake
(feed disappearance) may be greater because of feed wastage, variations in
protein and energy utilization, and environmental conditions.
Total lysine needs (Figure 5) in grams per day were determined based upon the
pigs' protein mass and daily protein accretion. The lysine need of the pig
follows that of lean accretion. Simply stated, the greater the lean accretion,
the greater the lysine requirement. With protein accretion rates of 80 to 135
grams per day, the daily lysine requirements ranged from 12 to 18 grams per
day.
The lysine to energy requirements (g lysine/Mcal ME) were determined daily by
dividing the lysine requirement by the estimated daily energy requirement
(Figure 6). Based upon this analysis, Farm 2 was over-feeding lysine, especially
in the late finishing phase. As expected, the pigs on Farm 1 have a greater
lysine to energy requirement. Gilts have a greater lysine to energy requirement
than barrows.
The standard errors of growth curves are shown in Figure 7. The standard
errors of the growth rates are larger at live weights under 100 lb and above 225
lb. This is expected because in general, the confidence bans for the predicted
values of any type of regression increase as the values of the independent
variable (age in this case) approach the upper and lower values. This increase
in the live weight curves is important, as the live weight growth curves are
used, in part, to predict all subsequent daily body component growth curves and
daily nutrient requirements.
The standard errors of the daily protein and lipid accretion rates are shown
in Figures 8 and 9. The standard errors for protein accretion are greater at the
lower and upper live weights. The standard errors are greatest for the gilts
from Farm 2 due to the increased RSD of both the live weight to time and EBP to
live weight functions.
The standard errors of the daily energy intake curves are shown in Figure 10.
The standard errors of the predicted energy intake curves are relatively small.
This is likely caused by the fact that the standard errors of the lipid
accretion curves are small. The standard errors of the predicted daily lysine
requirements are shown in Figure 11. The standard errors of the daily lysine
requirements follow the identical pattern of the standard errors of the protein
accretion curves. The standard errors of the predicted lysine requirements are
largest at the lightest and heaviest live weights. The standard errors of the
lysine to energy intake curves are shown in Figure 12. The standard errors of
the lysine to calorie ratios are greatest from 50 to 100 lb liveweight.
Application
The results of the bootstrapping procedures indicate that the use of
serial live weights and ultrasonic measurement of 40 pigs of the same sex will
result in acceptable standard errors. However, the standard errors of all
predicted variables increased at live weights from 50 to 90 lb and 220 to 250
lb. Additional refinement of the procedures is necessary to reduce the standard
errors at the beginning of the grower and end of the finishing stage.
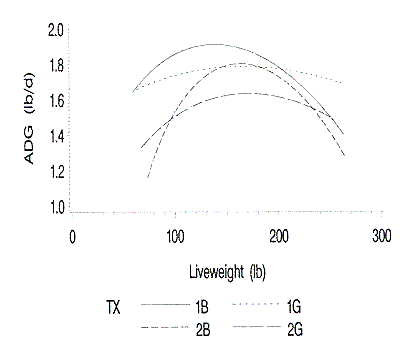
Figure 1. Relationship of average daily gain to liveweight. 1B and 1G are
barrows and gilts on farm 1; 2B and 2G are barrows and gilts on farm 2.
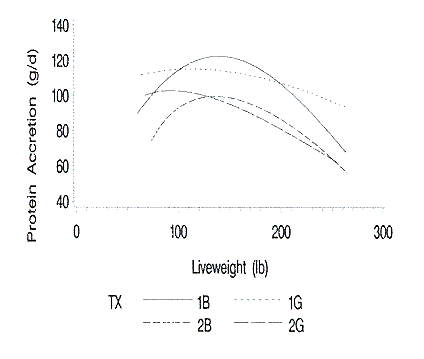
Figure 2. Relationship of protein accretion to liveweight. 1B and 1G are
barrows and gilts on farm 1; 2B and 2G are barrows and gilts on farm 2.
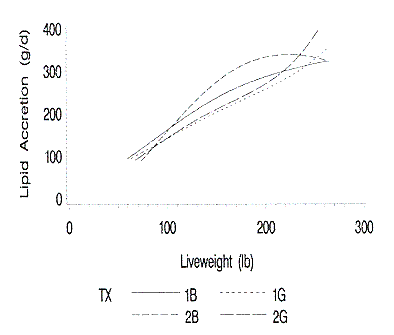
Figure 3. Relationship of lipid accretion to liveweight. 1B and 1G are
barrows and gilts on farm 1; 2B and 2G are barrows and gilts on farm 2.
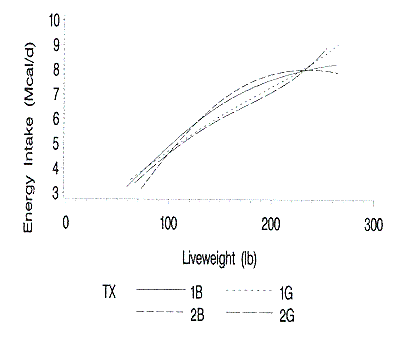
Figure 4. Relationship of predicted daily energy intake to liveweight.
1B and 1G are barrows and gilts on farm 1; 2B and 2G are barrows and gilts on
farm 2.
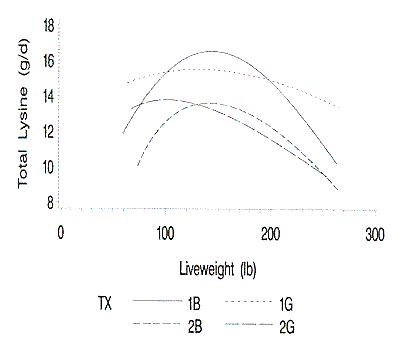
Figure 5. Relationship of predicted daily dietary lysine requirement
to liveweight. 1B and 1G are barrows and gilts on farm 1; 2B and 2G are barrows
and gilts on farm 2.
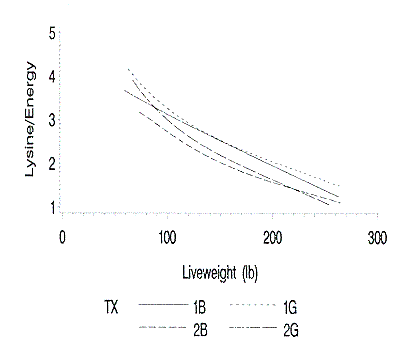
Figure 6. Relationship of predicted lysine to energy ratio (g lysine /
Mcal ME) to liveweight. 1B and 1G are barrows and gilts on farm 1; 2B and 2G are
barrows and gilts on farm 2.
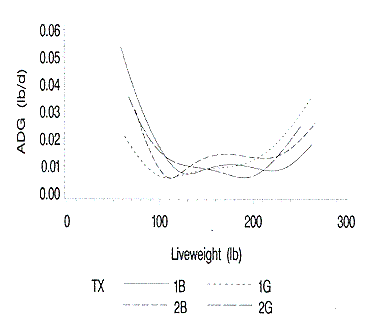
Figure 7. Standard errors of the average daily gains as fit by the
growth functions at each liveweight. 1B and 1G are barrows and gilts on farm 1;
2B and 2G are barrows and gilts on farm 2.
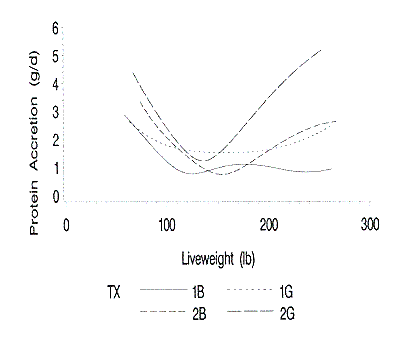
Figure 8. Standard errors of the predicted protein accretion rates at
each liveweight. 1B and 1G are barrows and gilts on farm 1; 2B and 2G are
barrows and gilts on farm 2.
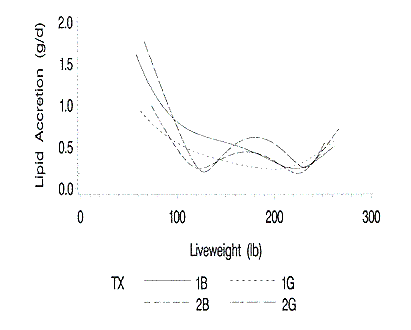
Figure 9. Standard errors of the predicted lipid accretion rates at
each liveweight. 1B and 1G are barrows and gilts on farm 1; 2B and 2G are
barrows and gilts on farm 2.
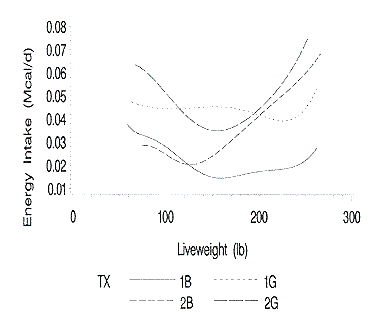
Figure 10. Standard errors of the predicted daily energy intakes at
each liveweight. 1B and 1G are barrows and gilts on farm 1; 2B and 2G are
barrows and gilts on farm 2.
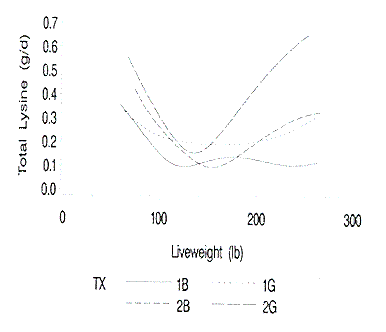
Figure 11. Standard errors of the predicted daily lysine requirements
at each liveweight. 1B and 1G are barrows and gilts on farm 1; 2B and 2G are
barrows and gilts on farm 2.
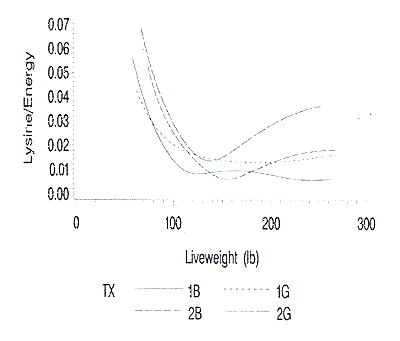
Figure 12. Standard errors of the predicted lysine to energy ratios at
each liveweight. 1B and 1G are barrows and gilts on farm 1; 2B and 2G are
barrows and gilts on farm 2.
Index of 1998 Purdue Swine Day Articles
If you have trouble accessing this page because of a
disability, please email
anscweb@purdue.edu.
 where
ei is the residual value for the ith observation, n is the
number of observations, and p is the degrees of freedom for the model. For the
vast majority of cases, the generalized non-linear function resulted in the
smallest RSD values for live weight and EPB; as a result these equations were
used for all curves.


