Purdue University 1998 Swine Day Book
A.P. Schinckel, D.L. Lofgren, and M.E. Einstein
Department of Animal Sciences
Since the mid 1980's, STAGES has calculated bioeconomic indexes. These weight the expected progeny deviations (EPDs) of traits relative to their economic value and the intended use of the pigs in commercial crossbreeding systems.
In the past, the terminal sire index weighted the EPDs for days to 230 lb, backfat thickness, and feed conversion relative to their economic values. The economic value assigned to backfat thickness was $10.86 per inch, or approximately a .1% change in value per .1 inch change in backfat depth. The EPD for feed conversion was estimated based on its genetic relationships to backfat thickness and days to 230 lb. The terminal sire index was developed so that each index point had a value of $.10 per index point per offspring produced.
The maternal line index included EPDs for number born alive, number weaned adjusted for number after transfer (a measure of survival to weaning), 21-day litter weight, and the postweaning traits. The reproductive and postweaning traits are weighted with the realization that a parent gilt in a terminal crossbreeding system expresses her genetic potential for the reproductive traits, and passes half of her genetic potential for the postweaning traits to her offspring.
Since the mid 1980's, the pork industry has undergone constant changes. Pork processors began shifting the ideal weight ranges of their lean payment systems to heavier weights. Currently, the optimal live weight on the majority of pork processor payment systems is close to 250 lb live weight. For this reason, NSIF has recently increased the suggested off-test weights to 250 lb.
During the late 1980's to mid 1990's, pork processors increased their focus on the production of highly trimmed lean cuts and low fat, value-added products. The economic value of backfat depth increased from approximately $10.00 to a range of $14.00 to 18.00 per inch. In 1996, NSIF estimated the economic value of backfat to be $15.00 per inch.
The use of real-time ultrasound increased dramatically during the 1990's. Independent real-time scanning companies became available across the Midwest. NSIF initiated a certification program for real-time scanners to certify their accuracy in measuring both backfat depth and loin eye area. The combined impact of the implementation of carcass merit programs, increased use of real-time ultrasound and availability of across-herd STAGES EPDs has resulted in intense selection for increased leanness.
To account for the changes in the pork industry and to refine the direction of future genetic selection, the STAGES indexes underwent evaluation and change. The first change was to increase the weight off test from 230 to 250 lb, to reflect the current increased average market weights. Growth rate is now evaluated as days to 250 lb. Backfat depth is adjusted to 250 lb live weight. The economic value for feed conversion assumes pigs are fed to 250 lb live weight. Additionally, an EPD is now calculated for loin muscle area adjusted to 250 lb live weight.
The second change was that an EPD for pounds of lean adjusted to 250 lb live
weight (LBLEAN) was calculated based upon the backfat depth and loin muscle area
EPDs. The equation used is:
LBLEAN EPD = (-20.3 x Backfat EPD) + (3.41 x Loin Muscle Area EPD)
where backfat EPD is in inches, and loin muscle area EPD is in square
inches.
The third change in the STAGES index was the development of a curvilinear economic relationship between carcass value and measurements associated with leanness. In 1997, representatives of four major pork processors were confidentially interviewed as to their current and anticipated future carcass merit buying systems. Currently, one pork processor actually reduces the premium for pigs with less than .67 in. (17 mm) backfat thickness due to an increased incidence of pork quality problems in extremely lean carcasses. One pork processor pays no additional premium for pigs under .60 in. backfat thickness. All four pork processors independently agreed on the following issues:
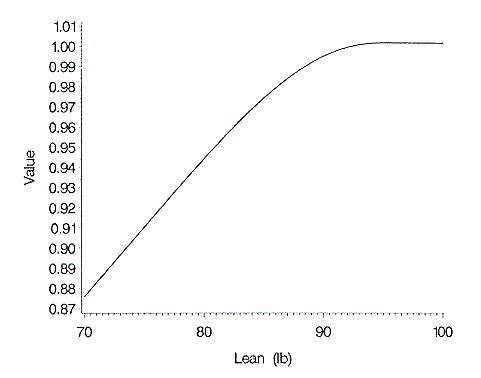
The current and future anticipated carcass merit systems were scaled to a common value ratio basis where carcass value = base price x value ratio. A base price of $112.50 was assumed for a pig of 84 lb of lean adjusted to a 185 lb carcass weight (LBLEAN; 250 lb nonshrunk live weight; 240 lb shrunk live weight). The value ratio was transformed to a value index. The maximum carcass value index (1.00) was attained at 94 lb LBLEAN.
An example was calculated assuming a base price of $112.50 per pig (250 lb live weight). The relationship between carcass value and LBLEAN is shown in Figure 1. The slope of the dollar value at a specific value for pounds of lean is the marginal value of the next incremental pound of lean. Table 1 shows the incremental value per incremental LBLEAN EPD or per incremental .1 inch change in backfat depth EPD. The marginal value becomes smaller as the pigs become leaner and becomes zero at 94 lb of LBLEAN.
The new STAGES indexes will utilize this curvilinear relationship between carcass value and the EPD for pounds of lean. The terminal sire index will use a base LBLEAN value of 86 lb, so the economic value for backfat at a 0 EPD for backfat will be $11.44 per inch, similar to the value of $10.86 used previously. A base value of 91 lb for LBLEAN will be used for the maternal line index, which will reduce the economic value of backfat to about 50% of that of the old MLI. It is important to realize that as the pigs become leaner, the EPDs for LBLEAN will increase as the component EPDs for backfat depth and loin muscle area change. As the EPDs for LBLEAN increase, the additional economic (dollar) value of each one pound incremental increase in LBLEAN will become smaller. Because the maternal line index uses a higher base (LBLEAN value of 91 versus 86 for the terminal sire index), the very leanest individual boars and gilts will be given a decreased economic value and emphasis in the MLI. Figure 2 shows the old and new MLI in a population of pigs in relationship to their EPDs for LBLEAN.
Because of the changed emphasis on leanness, the new MLI will not rank individuals the same as the old MLI. An example of two such sires is presented in Table 2. The first sire (Sire A) has an extremely low backfat EPD of -.164 and a high LBLEAN EPD of +3.33. He is close to average on growth, with an average EPD for days to 250 lb of -.6. His MLI decreased 8.3 index points from the old to the new MLI because of the decreased overall economic value of leanness and the curvilinear economic value for LBLEAN. The second sire (Sire B) is average for both growth and leanness. On an EPD standard deviation basis, Sire B is equally superior for growth and leanness. The new MLI for Sire B is 2.8 index points lower than the old MLI due to the overall decreased emphasis on leanness.
Based on the old MLI, Sire A was 3.1 index points superior to Sire B. Based on the new MLI, Sire B with the more balanced growth and LBLEAN EPDs is 2.4 index points superior to Sire A. The new MLI favors more genetically balanced pigs in terms of growth rate, leanness and SPI than the old MLI. The new MLI will favor herds who do not overemphasize leanness at the expense of genetic improvement of the growth and reproduction EPDs.
The new STAGES indexes will remain similar to the old indexes in that they are bioeconomic indexes with a specified dollar value per offspring or daughter litter. The changes made to the indexes, especially the MLI, should result in better weighting of growth rate and leanness so that selection for extreme leanness will be avoided.
Figure 1. Relationship of carcass value to pounds of fat-free lean adjusted to 250 lb live weight.
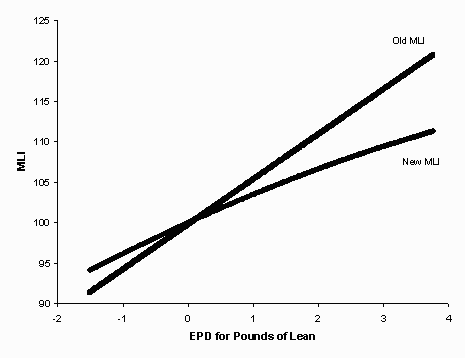
Figure 2. Relationship of old and new MLI to EPD for pounds of lean.
Table 1. Incremental increase in carcass value per one pound increase in fat-free lean EPD or one-tenth inch increase in backfat thickness EPD.
|
Incremental change in carcass value |
|
|---|---|---|
Pounds of |
Change/1 lb |
Change/.1 in. |
83 |
.684 |
1.388 |
84 |
.648 |
1.317 |
85 |
.610 |
1.239 |
86 |
.563 |
1.144 |
87 |
.514 |
1.043 |
88 |
.459 |
.933 |
89 |
.400 |
.812 |
90 |
.336 |
.682 |
91 |
.267 |
.543 |
92 |
.193 |
.393 |
93 |
.115 |
.234 |
94 |
.032 |
.065 |
Table 2. Comparison of the indexes and EPDs of two maternal sires.
|
Sire A |
Sire B |
|---|---|---|
EPDs |
|
|
NBA |
.35 |
.38 |
NW |
.08 |
.04 |
LW |
6.30 |
4.53 |
DAYS |
-.65 |
-5.10 |
Backfat |
-.164 |
-.077 |
LBLEAN |
3.33 |
1.57 |
Indexes |
|
|
Old MLI |
128.9 |
125.8 |
New MLI |
120.6 |
123.0 |
Difference |
8.3 |
2.8 |
SPI |
109.0 |
108.1 |
Index of 1998 Purdue Swine Day Articles
If you have trouble accessing this page because of a disability, please email anscweb@purdue.edu.