Purdue Pork Page Archive
VIABILITY OF BIOAEROSOLS PRODUCED FROM A SWINE FACILITY
M.J. Homes, A.J. Heber, C.C. Wu, L.K. Clark, R.H. Grant, N.J. Zimmerman,
M.A. Hill, B.R. Strobel, M.W. Peugh and D.D. Jones
ABSTRACT
Bioaerosol concentrations were measured around a commercial farrow to finish swine production facility. Viable particles were sampled inside the buildings and at several outdoor locations up to 300 m downwind. A dramatic decrease in total bacteria concentrations occurred from inside the facility to areas immediately outside. Background concentrations of total bacteria were amplified by the facility up to 200 m downwind. The results seemed to confirm that airborne microorganisms are able to travel considerable distances while maintaining viability. Streptococcus Suis and Haemophilus bacteria were found only at downwind locations. Greater viability and therefore higher levels of emitted bacteria are expected during cloudy days and higher outdoor relative humidity.
Introduction and Objectives
A bioaerosol is defined as a cloud of biological particles with biological action indicated by viability, infectivity, allergenicity, toxicity, or pharmacological activity (Cox and Wathes, 1995). They are produced from the fragmentation of biological materials. The diameter of bioaerosol particles ranges from approximately 0.3 µm to 100 µm. These biological particles are almost always present outdoors. Their types and viability can change with time of day, season, weather and geographic location.
Many sources of bioaerosols are man-made, such as sewage and animal waste disposal facilities. In animal houses, bioaerosols are produced from animals, feed, bedding, and feces (Cox and Wathes, 1995). Bioaerosols can be inhaled by other animals and cause infection. Considerable evidence suggests that pathogens of animals are spread by droplet nuclei or on dust (Donaldson, 1978). Dust levels in an animal house are relatively high, especially when dry feeding or large quantities of friable bedding are used. Concentration is affected by animal activity and building ventilation. In general, concentrations of bioaerosols will be higher in animal houses than residential, industrial, or ambient settings. Higher bioaerosol levels occur when dust is stirred up during cleaning, feeding, or handling of the animals.
There is an interest in the effect of bioaerosols released into the natural environment. Microorganisms are introduced into the atmosphere from various sources, transmitted downwind via the airstream, and finally deposited on some surface (Lighthart and Frisch, 1976). Deposition of airborne particles occurs by gravitational fallout or by wind impaction onto surfaces. Particles may be carried by air currents some distance from their source and may present occupational as well as public health considerations (Cox, 1989). Using a mathematical model, a concentration of 14 million viable bacteria per m3 occurring in the ground level atmosphere 1000 m downwind from a point source was calculated under certain conditions (Lighthart and Frisch, 1976). It was estimated that a person at this same location could inhale 84,000 bacteria per minute (Sodeman, 1961).
Costs of bioaerosols to humans and agriculture can be severe. According to a 1981 National Health Survey, 200 million cases of respiratory infection were reported in the United States; 150 million days were lost from work; $10 billion in medical care costs were reported; and an additional $10 billion of work income was lost. Bioaerosols can also cause substantial economic losses to agriculture and respiratory diseases in animals can be increased by exposure to high bioaerosol concentrations.
Many factors can be detrimental to bioaerosol survival. The very process of aerosol sampling may be responsible for some organisms loss of ability to survive because of the severity of physical forces acting on particles during sampler operation (Marthi et al., 1990). However, besides the sampling process, other conditions determine if an organism will survive once it has been aerosolized. Air movement can cause particles to travel great distances. For example, pollen deposits have been observed at the earth's poles. The question is how far can bacteria travel and still be viable? For many microorganisms, the airborne environment is hostile because of desiccation, radiation, oxygen toxicity, and pollutants (Cox, 1989). The release of bioaerosols could lead to dissemination of these organisms to unintended locations, but if bioaerosols are stressed or injured due to aerosolization, they would be ecologically insignificant (Walter et al., 1990).
The ability of microorganisms to survive the airborne state depends on the severity of the imposed trauma and the ability to repair the resulting damage (Cox, 1989). More specifically, aerosolization can cause stress on bacterial populations, which are the focus of this experiment. The survival of aerosolized bacteria is influenced by growth conditions prior to aerosolization, the environmental conditions during aerosolization, the methods of aerosolization, and as previously mentioned, of collection and enumeration (Marthi et al., 1990).
Environmental conditions during aerosolization include cellular and atmospheric conditions. Cellular conditions, for purposes of this experiment, include size of the bioaerosol and also the size of the droplet it is encased in. Larger cells or cells encased in larger droplets have a better chance of surviving the airborne state.
Atmospheric conditions refer to relative humidity (RH), temperature, oxygen concentration, ultraviolet radiation, and air pollutants. The major atmospheric factors affecting the survival of airborne microorganisms are humidity and temperature (Ehrlich et al., 1969). Substantial previous research has found a trend of higher bioaerosol survival rates at higher RH and lower temperatures and lower survival rates at lower RH and higher temperatures (Webb, 1959, Ehrlich et al., 1969, Marthi et al., 1990, Walter et al., 1990). Oxygen, radiation, and pollutants can also be detrimental to bioaerosol survival.
Current theory in swine management indicates that isolating newborn piglets will lessen the risk of disease exposure, allowing them to be brought to market faster. The question the industry is now asking is at what distance can they place these isolation buildings from the existing facility to protect them from bacterial contamination. This experiment was conducted at an Indiana farmstead. The producer was considering building a nursery and the quality of air around the present facility was an important consideration in deciding where to put this new building. An initial test confirmed the presence of airborne bacteria near the facility. A second investigation found higher bioaerosol concentrations immediately downwind of the facility (Homes, et al., 1995). The sampling effort reported in this paper expands on the first two by sampling at sites farther away from the facility to better understand how viability of pathogenic bacteria correlates with distance from the building. This data would be helpful in isolating on-site nursery buildings.
Materials and Methods
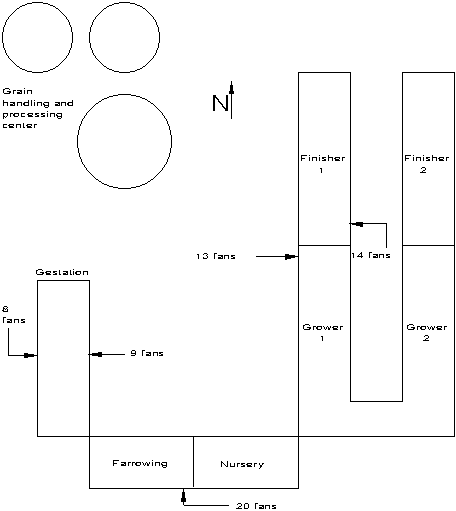
Measurements were taken at a 500 sow farrow-to-finish operation, Figure 1. All buildings were mechanically ventilated except finisher #2 which was a curtain-sided, inverted-V chimney building. The production complex was the southernmost facility on the farmstead and was surrounded by recently harvested cornfields to the east, west, and south. A gravel road was parallel to and 20 m west of the gestation building. Grain drying fans were operating at the time of sampling as were approximately half of the building's 64 fans.
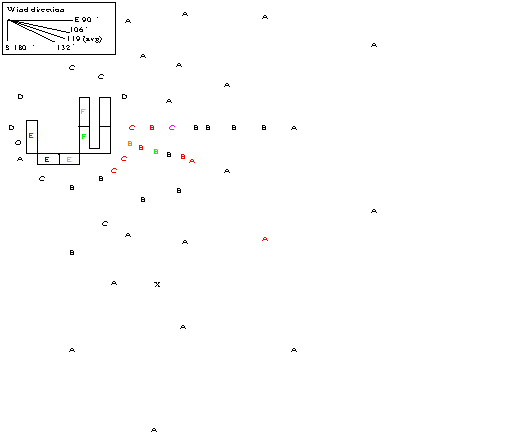
A 3-dimensional ultrasonic anemometer with a sampling rate of 10 Hz was located west of the gestation building at a height of 5.4 m. A mobile weather monitoring station was stationed SE of the facility, Figure 2. Most of the bioaerosol sampling locations were set up south and east of the facility on radials spaced every 30o, Figure 1. Sampling locations were at the intersection of circles and radials. Circle 1 was located 5 m from the NE corner of the buildings and encircled the entire facility. Circles 2 to 6 were placed 50, 78, 116, 188, and 300 m, respectively, from circle 1. Samples were taken at intermediate locations where high concentrations were anticipated.
Streptococcus, Hemophillus parasuis, Bacillus and E. coli bacteria were qualitatively tested at several locations inside and outside the swine facility. Total bacteria were also counted on two types of media; blood and chocolate. A non-selective blood medium (38 ml in standard plates) was used for detecting the presence of Streptococcus, and E. coli. A selective chocolate medium (45 ml in standard plates) was used for the detection of Hemophillus parasuis. Bacillus was detected on the chocolate media. Agar filled plates were placed in single stage Andersen samplers which were disinfected with alcohol wipes between samples. Two blood and two chocolate agar plates were used at each location. Pumps pre-calibrated to a flow rate of between 28.2 and 28.5 lpm were used with the Andersen samplers. Sampling times varied from 30 to 240 s depending on distance from the building. Samples nearest the building were taken approximately 0.5 m above the ground. Samples were taken approximately 1.0 m high except for those on circle 1 (0.5 m high).
Concentrations of total aerobic bacteria expressed as colony forming units (cfu) per m3 were calculated by dividing the total plate count by the average pump flow rate and sampling time. Averaged colony counts of total bacteria from each plate type and averaged post and pre-calibration airflows were used in the calculations at each sampling location.
Results
Average relative humidity was around 20%. Outdoor air temperature was 18 oC when bacteria sampling began at 9:45 a.m. and 26 oC when completed at 2:40 p.m. The average wind velocity was 4.8 m/s. The average wind direction during 13.33 minute ultrasonic anemometer records varied from 106 to 131, as shown in Figure 2 by dashed lines downstream of the facility. These lines define a rough estimate of the plume of emissions from the building.
Concentrations of total aerobic bacteria are shown in Figure 2. Concentrations inside the buildings ranged from 30,000 and 290,000 cfu/m3 with the highest occurring in the grower building. Concentrations on the inner circle just outside the buildings ranged from 1000 to 15,000 cfu/m3. Concentration averages for the buildings and sampling circles are shown in Table 1. Concentrations generally decreased with distance from the facility.
Enterococcus, Streptococcus suis and Alpha Streptococcus were identified inside and downwind of the buildings. The Hemophillus species, which is very difficult to detect, was not detected on any samples. Many Bacillus colonies were identified on chocolate media outside the facility.
Table 1: Average Concentrations of Total Aerobic Bacteria
| Location | blood media | chocolate media |
|---|---|---|
| inside buildings | 121,070 | 128,497 |
| circle 1 (5 m) | 5813 | 4820 |
| circle 2 (50 m) | 2333 | 2960 |
| circle 3 (78 m) | 1173 | 2417 |
| circle 4 (116 m) | 840 | 2436 |
| circle 5 (188 m) | 577 | 2542 |
| circle 6 (300 m) | 450 | 1342 |
Discussion
Concentrations at most sampling locations indicated atmospheric dispersion from the buildings. However, bioaerosol levels at some locations deviated from the pattern. Several colonies of Bacillus, a soil-bound microorganism, were identified on outdoor samples only and apparently was the primary cause of high concentrations upwind of the building.
Concentrations of total bacteria detected from blood media were probably more accurate since colonies were more isolated and easier to count than those on chocolate media. They were used primarily for total bacteria data in this paper unless otherwise indicated.
A possible cause for higher counts upwind from the enclosed source may have been re-suspension of soil particles. Viable microorganisms apparently re-suspended from the ground surface which had been dry for 12 days prior to sampling. Bacillus was apparently re-suspended from the ground and was captured by the samplers.
Resuspension of particles from the ground surface may have been caused by wind gusts, the grain operation located immediately northwest of the livestock buildings, or activity of the sampling teams. The grain drying facility was operating during the time of this experiment.
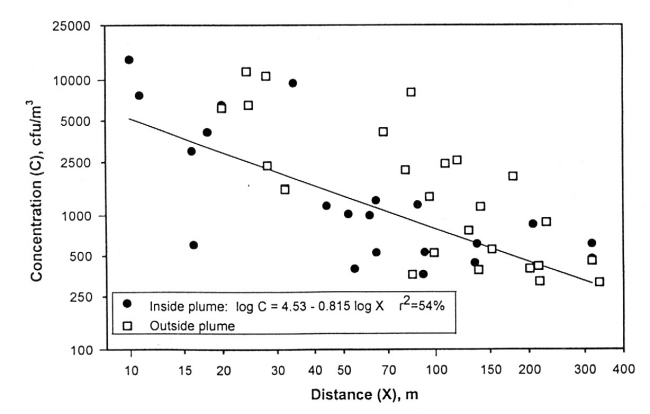
Concentrations of total bacteria determined were consistently low 300 m from the buildings. With the exception of one location northeast of the building, all concentrations were low at a distance 200 m away. The most distant pathogenic bacteria was detected downwind on circle 5, nearly 200 m from the buildings. Therefore, it appears from this very limited data that under similar conditions a reasonable area to place a new isolation nursery room would be at least 200 m away from the existing facility. To be safe, we suggest the nursery be placed 300 to 400 m. The isolating nursery should be placed upwind of prevailing winds to further minimize the chance of disease transer throught the air. More investigations are needed to more accurately ascertain the dispersion of bacteria from swine facilities. This day was not conducive to bacterial viability because it was very dry and sunny.
References
Cox, C.S. 1989. Airborne Bacteria and Viruses. Science Progress, Oxford. 73:469-500.
Cox, C.S. and C.M. Wathes. 1995. Bioaerosols Handbook. Lewis Publishers, New York.
Donaldson, A.I. 1978. Factors Influencing the Dispersal, Survival, and Deposition of Airborne Pathogens of Farm Animals. The Veterinary Bulletin. February, p. 83-94.
Ehrlich, R., S. Miller, and R.L. Walker. 1970. Relationship Between Atmospheric Temperature and Survival of Airborne Bacteria. Applied Microbiology. February, pp. 245-249.
Homes, M., B. Strobel, C.C Wu, and A.J. Heber. 1995. Unpublished data. Agricultural and Biological Engineering Department. Purdue University.
Marthi, B., V.P. Fieland, M. Walter and R.J. Seidler. 1990. Survival of Bacteria During Aerosolization. Applied and Environmental Microbiology. November, pp. 3463-3467.
Lighthart, B., A.S. Frisch. 1976. Estimation of Viable Airborne Microbes Downwind from a Point Source. Applied and Environmental Microbiology. May, p. 700-704.
Sodeman, W.A. 1961. Pathogenic Physiology. W.B. Saunders Co.
Walter, M.V., B. Marthi, V.P. Fieland and L.M. Ganio. 1990. Effect of Aerosolization on Subsequent Bacterial Survival. Applied and Environmental Microbiology. November, pp. 3468-3472.
Webb, S.J. 1959. Factors Affecting the Viability of Airborne Cells: I. Cells Aerosolized from Distilled Water. Canadian Journal of Microbiology. May, p. 649-669.
US Department HEW. 1981. Current estimates from the National Health Interview Survey. Vital and Health Statistics.
Acknowledgements
Cooperation from swine producer Lynn Fisher, support from the Purdue University Agricultural Research Programs, and sampling assistance from Sandy Amass, Bill King, Roberta Alvarez and Joel Florez was appreciated.

Figure 1. Layout of the 500-sow farrow to finish production system

Figure 2. Bioaerosol levels. A: log C<3; B: 3<log C<3.5; C: 3.5<log C<4.0; D: 4.0<log C<4.5; E:4.5<log C<5.0. symbols are as follows:*= Alpha Streptococcus, "= Enterococcus, -= Streptococcus suis. Locations of the ultrasonic anemometer and portable weather stations are shown by symbols O and X, respectively.

Figure 3. Concentration of total aerobic bacteria, C, as influenced by distance from the swine facility. The plume was defined in figure 2.
Purdue Pork Page Archive