Purdue Pork Page Archive
Concepts of Pig Growth and Composition
A.P. Schinckel and M.E. Einstein
Department of Animal Sciences
Pork producers have economic incentives based on consumer demand and carcass-value marketing programs to produce lean pork as efficiently as possible. Changes in the absolute and relative rates of lean and fat gain determine the efficiency of lean gain and, ultimately, carcass composition. Thus, pork producers must increase lean growth rates by implementing genetic and management improvements.
Pig growth results from a multitude of biological processes. The genotype of an animal determines the maximum level at which these processes can occur, whereas environmental factors such as health status, nutrition, ambient temperature, social hierarchy and pen density determine the degree to which genetic potential is expressed. Thus, in order to evaluate and implement genetic and management strategies which potentially enhance pig growth, an understanding of the relationships between pig genotype and environmental factors is essential.
Data from a 1994 swine growth trial, which included 320 barrows and gilts of two terminal crosses, demonstrate the essential concepts of pig growth. The pigs were segregated early weaned to produce a high health status, fed high density diets (Table 1), and given 18 ft2 per pig after 50 lb liveweight to provide an optimum environment for maximizing lean growth rates. Feed intakes and liveweights were recorded weekly from 12 to 54 days of age and every two weeks thereafter. Serial estimates of composition were obtained from real-time ultrasound measurements of pigs, taken every two weeks, and carcass measurements. Prediction equations from a large lean growth trial (1991) were used to estimate each pig's composition at each measurement time.
The data were statistically analyzed for each genotype and sex with a series of nonlinear equations. Liveweight was fit to a three-parameter growth curve, WT = MW * (1-e-mta) + 3, where WT is liveweight in lb, MW is predicted mature weight in lb, t is age in days, and m and a are growth parameters. The mass of each component (Y) was expressed as either an allometric (Y = aWTb) or augmented allometric (Y = aWTb(c-WT)d) function of liveweight (WT). Feed intake in lb/day was fit as a nonlinear function of liveweight (WT): FI = MFI * (1-be-cWT), where MFI is an estimate of mature feed intake and b and c are function parameters. The growth of each component was estimated based on the liveweight growth curves and the body component to liveweight functions. Feed conversion and lean feed conversion curves were estimated from the feed intake and either liveweight or fat-free lean growth curves.
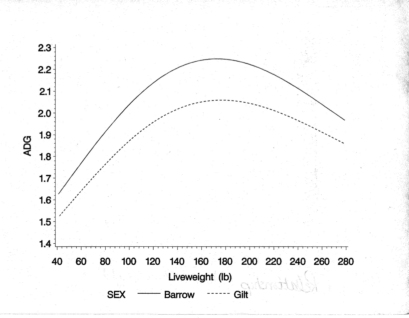
Commercial producers are more familiar with liveweight gain, feed conversion, and feed intake data (Figures 1-3). Growth rate increases as liveweight increases, reaches a plateau, and then slowly declines after 200 lb. Feed intake increases linearly from 40 to 140 lb. After 140 lb, feed intake increases more slowly. Barrows have both higher daily growth rates and feed intakes than gilts. Feed conversion (lb of feed per lb liveweight gain) increases from 2.0 at 40 lb to 4.0 for barrows and 3.5 for gilts at 280 lb.
Fat-free lean gain (Figure 4) is highly associated with protein accretion (Figure 5). Protein accretion and fat-free lean gain are measures of fat-free body growth. Protein accretion includes the protein in all body components including the head, carcass, visceral organs, feet, skin and bone. Carcass fat-free lean is the total dissected carcass muscle tissue minus the fat contained within the dissected muscle. The growth curves for lean gain and protein accretion are similar. Muscular pigs have a higher ratio of lean gain to protein accretion than less muscular pigs. Prediction equations for fat-free lean place more emphasis on loin eye area measurements than the empty body protein accretion prediction equations. For these reasons, the protein accretion and fat-free lean curves from different sexes and genotypes are slightly different. Daily protein accretion and lean growth rates increase and reach maximum at 120 to 160 lb. After 160 lb, daily lean gain and protein accretion decline. The protein accretion rates of barrows and gilts are similar. Barrows achieve their maximum lean growth rate at lighter weights than gilts. After 205 lb, gilts have increasingly higher lean growth rates than barrows. Daily fat gain increases with liveweight and reaches a plateau at approximately 200 lb (Figure 6). The fat gain of barrows increases more rapidly and is noticeably higher than for gilts after 160 lb. Barrows have more energy available for fat deposition from their higher feed intakes.
The changes in the composition of pigs are the result of changes in the relative growth rates of fat-free lean and carcass fat (Figure 7). At 40 lb, pigs gain 2.2 lb of fat-free lean for each lb of carcass fat. At 280 lb, barrows gain .8 lb of lean for each lb of carcass fat, while gilts gain 1.5 lb lean per lb of fat gain. The poorer feed conversion observed in barrows after 200 lb liveweight is caused by a lower ratio of lean gain to fat gain for barrows than for gilts.
Another method to quantify pig growth is to evaluate the amount of carcass lean and fat gain which occurs with each additional pound of liveweight gain. The amount of lean gain gain per lb liveweight gain increases slightly from 40 to 110 lb and then declines (Figure 8). The amount of fat gain per lb of liveweight gain increases uniformly from 40 to 260 lb (Figure 9). Percent lean decreases as lean growth rate declines and fat gain increases.
Lean feed conversion (pounds of feed required to produce one pound of fat-free lean) increases from 5.5 in 40 lb pigs to 16 for barrows and 12 for gilts at 280 lb (Figure 10). Thus, as pigs grow, they become less efficient at converting feed to lean primarily due to the decreasing ratio of lean gain to fat gain.
Two primary methods to increase lean growth rate are through genetic or management changes. Consistent selection for the fastest gaining, leanest boars and gilts by seedstock producers can produce a 2.0 to 2.5 percent annual improvement in lean growth rate or protein accretion. Differences of over 30 percent in maximum achievable lean growth rates exist among seedstock sources. Figure 11 shows the daily fat-free lean growth curves for three genotypes of barrows. The lean gain genotypes achieve high maximum protein accretion at heavier weights and maintain higher protein accretion rates to heavier weights. For this reason, pigs of high lean growth genotypes can maintain more efficient feed conversion (3.2) and acceptable backfat thickness (.80 in. or less) at 280 lb.
The second major influence on lean growth rate is environmental factors, including health status, housing type, pen density, temperature, social stress, and air quality. Research conducted with differences in pen density, temperature stress and disease exposure indicates that environmental stressors limit protein accretion and lean gain. For example, increasing nutrient density of the diets will not result in increased lean growth when pigs are either limited by pen space or exposed to disease. This confirms what has been known for a long time: environment limits genotypic expression.
The maximum commercially achievable or operational daily protein accretion rates determine the pig's nutrient requirements for growth. To develop operational protein accretion or fat-free lean curves, animals must be fed non-limiting diets and housed in the best representative commercial environment possible. Pigs must be weighed periodically, and serial estimates of composition must be collected using real-time ultrasound and carcass data.
An example of plausible protein accretion curves under ideal conditions and three commercial environments is presented in Figure 12. The maximum protein accretion curve is derived from actual data from high lean growth barrows managed under ideal conditions. Under ideal conditions , a growth rate of 2.55 lb/day and feed conversion of 1.55 lb feed/lb gain were achieved from 45 to 115 lb. Average daily gain approached 2.4 lb/day with 2.4 feed conversion from 55 to 260 lb. At 260 lb liveweight, feed conversion approached 3.0.
Due to the fact that nursery pigs are more sensitive to health status and management, the above average pork producer might achieve 75 to 80 percent of maximal protein accretion from 30 to 70 lb, and near 220 lb actually achieve 100 percent of maximum protein accretion. This might be a producer with high-health status pigs in an excellent nursery. Three-site production in good facilities allows grow-finish growth rates of over 2.0 lb per day. The primary environmental limitations are animal density, pen size, and social effects of 10 to 20 pigs per pen.
The average herd might have implemented an all-in, all-out production system, but has chronic health problems with a lower level of management. Feed intakes and growth rates are lower than the high health status pigs. Pigs are gaining 1.65 lb per day, and are achieving 65 to 70 percent of their potential protein accretion. They approach 85 percent of their potential from 220 to 250 lb.
The lowest curve is for a below average producer utilizing continuous-flow management with lingering diseases. The facilities might have ventilation and environmental control problems. Feed intakes and growth rates are lower and more inconsistent than the other herds. Pigs are growing at 50 percent of maximum protein accretion in the nursery and achieve 72 percent of their maximum protein accretion from 220 to 250 lb. The pigs are likely growing at only 1.30 lb per day in the grower-finisher stage.
As genetic and management schemes are implemented which enhance pig growth, particularly muscle growth, other management factors must be considered. For example, nutritional programs must be evaluated as muscle growth is increased, as additional nutrients (i.e., protein, minerals, vitamins) are required to fuel the enhanced rates of muscle accretion. It should also be pointed out that environmental factors which reduce pig growth are more deleterious to higher lean growth genotypes because these factors (i.e., health status, social stress) decrease muscle tissue growth to a greater degree than fat tissue growth. Thus, the economic inefficiencies associated with a poor environment are greater in herds with a high genetic potential for lean growth compared with herds with moderate or low genetic potential.
In the future, pigs will become more intensely managed. Decisions will continue to be based on profits. The competitive pork producer will utilize genetic lines selected for high lean growth, which produce uniformly lean carcasses. Pork producers will carefully consider alternative methods to improve their pigs' lean growth rate and efficiency.
Table 1. Formulated Values (as-fed basis) of Crude Protein (CP), Lysine and Percent Added Fat of Diets Fed During Each Growth Phase.a
|
Diet |
Age, day |
CP |
% Lysine |
Feed Additive |
% Fat Added |
|---|---|---|---|---|---|
|
Nursery |
12-22 |
22.1 |
1.55 |
Apramycin |
2.0 |
|
Nursery |
23-44 |
21.8 |
1.50 |
Carbadox |
3.5 |
|
Nursery-Grower |
45-72 |
20.0 |
1.32 |
Carbadox |
5.0 |
|
Transition |
73-86 |
19.0 |
1.25 |
Tylosin |
5.0 |
|
Grower |
86-107 |
18.0 |
1.00 |
Tylosin |
4.0 |
|
Finisher |
107-market |
17.1 |
.90 |
Tylosin |
4.0 |
aThe first nursery diet contained 6% spray dried porcine plasma, 24% lactose, and 5% fish meal. The second nursery diet contained 2% spray dried whole blood meal, 5% fish meal and 16% lactose. The nursery-grower diet contained 1.0% spray dried whole blood and 1.0% fish meal.
Figure 1. Relationship of average daily gain to liveweight.
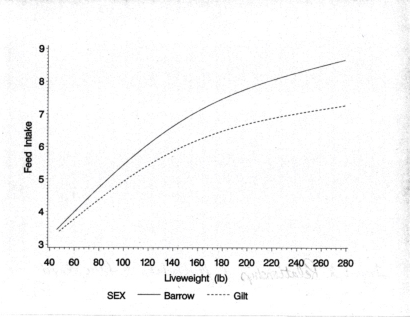
Figure 2. Relationship of feed intake to liveweight.
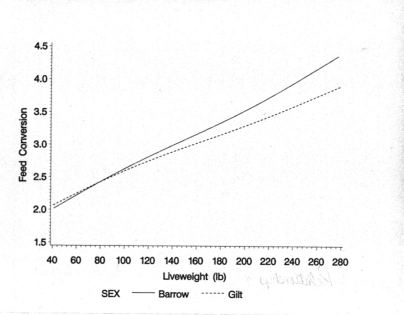
Figure 3. Relationship of feed conversion to liveweight.
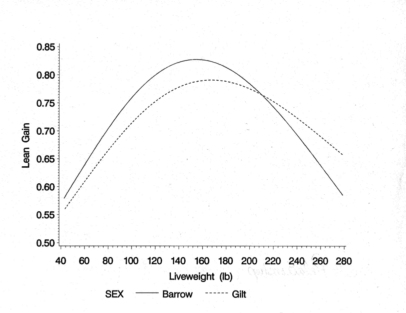
Figure 4. Relationship of fat-free carcass lean gain to liveweight.
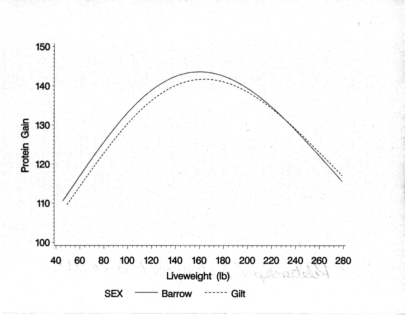
Figure 5. Relationship of daily whole body protein gain to liveweight.
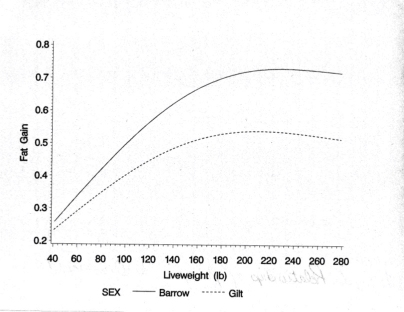
Figure 6. Relationship of carcass fat gain to liveweight.
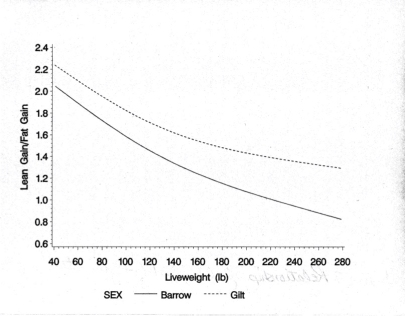
Figure 7. The ratio of daily carcass lean gain to fat gain at different liveweights.
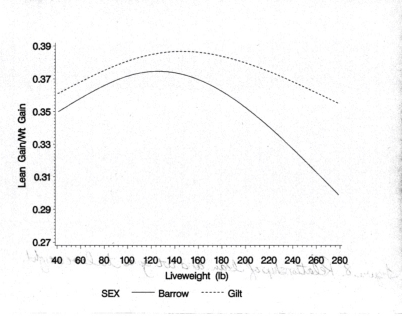
Figure 8. The ratio of carcass fat-free lean gain to liveweight gain at different liveweights.
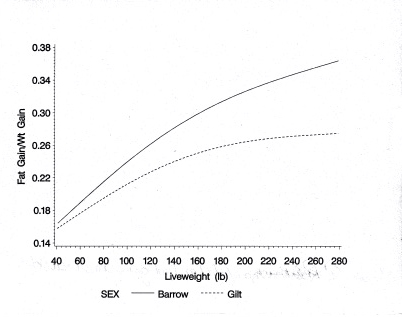
Figure 9. Ratio of daily carcass fat gain to liveweight gain at different liveweights.
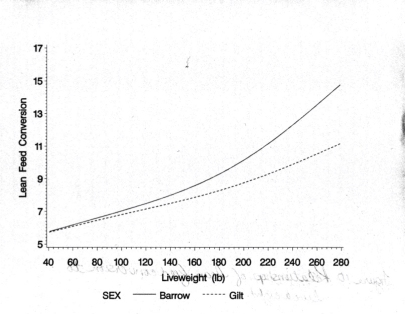
Figure 10. Relationship of lean feed conversion (lb feed/lb fat-free lean gain) to liveweight.
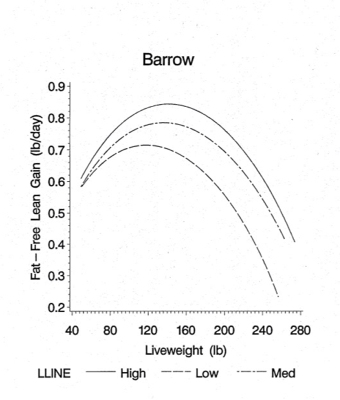
Figure 11. Relationship of daily fat-free lean gain to liveweight for three genotypes of barrows.
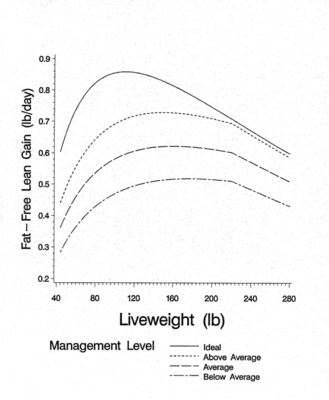
Figure 12. Relationship of daily fat-free lean growth rate to liveweight for ideal, above average, average and below average commercial environments.
Purdue Pork Page Archive