Purdue Pork Page Archive
Modeling Genetic and Environmental Effects on Pig Lean Growth
A. P. Schinckel, B. T. Richert, L. K. Clark, J. W. Frank and J. T. Turek
Purdue University
Introduction
The pork industry is driven by consumer demand for consistent quality lean pork products. To meet current and future consumer demand, the pork industry must continue to improve the efficiency of lean pork production. The two primary approaches for improving the efficiency of pork production are through genetic and environmental-management changes.
Each commercial producer must first decide which genetics he should use on his production facility. After making the key genetic decisions, each pork producer must consider cost-effective management changes to optimize the expression of genetic potential of their pigs. A number of alternative management decisions must be evaluated which are influenced by production costs (i.e., feed, facilities, labor and interest costs) and the relative rate of payment for carcass lean vs. fat in the marketing system.
Swine growth models are an integration of our current knowledge of the effects of genetic potential, nutrient intake, and environmental conditions on pig growth. These models can be used to identify alternative means to improve the efficiency of pork production and to estimate daily nutrient requirements for pigs of different ages and genetic groups when managed under a range of environmental conditions (de Lange and Schreurs, 1995). Recently, models have been developed that identify means of improving the efficiency of nitrogen and phosphorus retention in growing-finishing pigs and minimizing the potential contribution of pork production to environmental pollution.
Defining The Genotype
For an effective application of swine growth models, the maximum growth potential of pig genotypes must be accurately characterized. The three primary growth parameters required to characterize a genotype of pigs are: daily protein accretion, potential partitioning of energy intake above maintenance between protein and lipid accretion and daily energy intake (Schinckel and de Lange, 1996). The major hindrance to the implementation of swine growth models is the lack of accurate, yet economical, methods for estimating these parameters (Schinckel, 1994b).
Protein Accretion Rates And Potentials
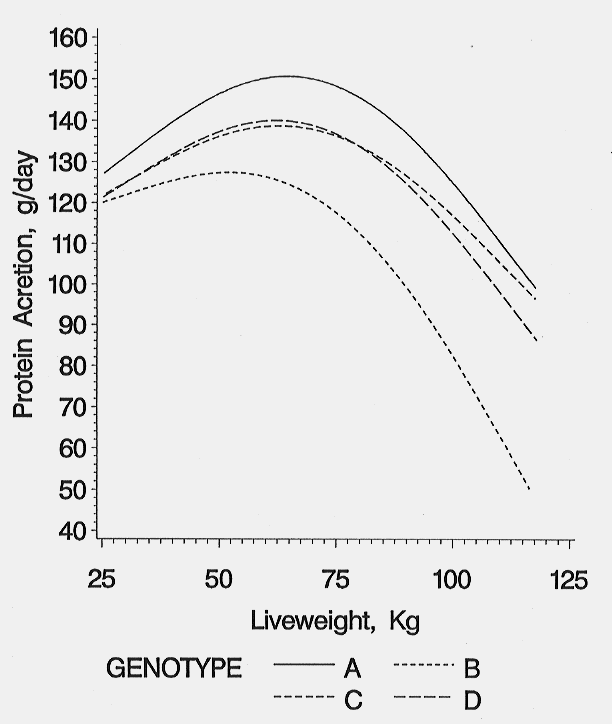
The protein accretion rates determine the pig's nutrient requirements for growth, composition of growth, and response to nutrition or management changes. Protein accretion curves have been developed for several commercially available genotypes under optimal conditions (Schinckel et al., 1995; Thompson et al., 1996). Protein accretion curves for four genotypes of terminal cross barrows representing high (A), medium-high (C and D) and medium (B) lean growth genotypes are presented in figure 1. The major differences between genotypes are the overall mean protein accretion rate and the rate in which protein accretion declines after 90 kg live weight. In general, genotypes with overall high protein accretion rates maintain higher protein accretion rates at heavier weights than average or below average protein accretion genotypes. To develop maximum protein accretion curves for a genotype, pigs must be fed nutritionally non-limiting diets. The dietary protein levels can alter the shape of the observed protein accretion curves (Friesen et al., 1996). Feeding protein levels below requirements for the genotype will limit protein accretion. Also, if the protein restriction is removed, compensatory growth may occur.
There are currently two economically feasible methods for estimating protein accretion curves (Schinckel and de Lange, 1996). The first method is to obtain serial B-mode (real-time) ultrasonic backfat depth and loin muscle area measurements to predict body component mass from 20 to 120 kg live weight. The second method to economically predict on-farm empty body protein accretion curves is from an estimate of the mean fat-free lean gain from 20-120 kg (Schinckel et al., 1996).
Energy Partitioning
The second parameter needed to characterize a genotype is its ability to partition different amounts of available energy to either protein (lean) or lipid (fat) growth. As feed intake increases, a linear response in lean growth and fat rate occurs. The change in protein accretion (or lean growth) per unit increase in energy intake is called the slope. As energy intake increases, protein accretion increases until a plateau occurs (Figure 2). The plateau is achieved when the energy required for maximum protein accretion is reached. Energy supplied in excess of a pig's maximum lean growth rate requirements will be utilized for fat deposition (Figure 3). This causes a rapid increase in lipid accretion and the ratio of lipid to protein accretion (Figure 4). Pigs with high lean growth rate potentials respond to higher energy intakes by increasing lean growth rate. The slope of lean gain (or protein accretion) on energy intake determines the extent to which energy intake is partitioned into lean versus fat gain. Pigs from 10-40 kg. live weight with moderate feed intakes during this time deposit a high proportion of lean and little fat. For this reason, improving management to increase feed intake at these live weights can be very cost effective because the additional nutrients will efficiently be used to increase lean gain. As a pig grows, the slope becomes less steep and the partitioning of energy changes so that at moderate energy intakes 70-80% of the intake is needed for maximum lean growth, the ratio of lean gain to fat gain declines. The slope of lean gain to energy intake decreases rapidly at heavier live weights (70-120 kg) as the pig's maximum lean growth rate declines. In other words, once a pig matures, and its lean growth rate declines, the partitioning of energy shifts so that even at moderate energy intakes the ratio of fat gain to lean gain increases (de Lange et al., 1995). Lean lines depositing a high proportion of lean due to steep slopes of protein accretion on energy intake require less energy to achieve the same lean growth rate. These genotypes have the potential to achieve very efficient lean growth due to their high ratio of lean to fat growth. However, these lean genotypes will also respond differently to environments which limit feed intake. Low feed intake genotypes which are gaining a higher proportion lean will respond to feed intake limiting environments with larger absolute and percentage drops in live weight and lean growth.
Energy Intakes
Swine growth models require an estimate of daily energy intake to estimate the other aspects of animal performance and nutrient requirements. Nonlinear equations have been primarily used to describe the curvilinear relationship between daily food or energy intake to either age or body weight (Schinckel and de Lange, 1996). If the empty body protein and body lipid accretion rates are determined for pigs given ad libitum access to feed, energy intake can be predicted largely based on the energetic cost of empty body protein and lipid deposition, estimated at 10.54 and 12.64 Mcal ME/kg, respectively (Smith et al., 1997). This approach requires an estimate of maintenance energy requirements which are assumed to be determined by empty body protein mass. Daily energy intakes at each live weight were predicted within 4% of observed feed disappearance for an on-farm example. Using this approach, it became obvious that the energy intake curves are driven by the pigs' energy demands for protein (lean) and lipid (fat) accretion. The use of different selection criteria has caused large genotype differences in feed intake. When feed cost is a high percentage of total cost and carcass value programs are widely implemented, lean efficiency and carcass merit become relatively much more important than growth rate. Feed intakes of pigs primarily selected for a combination of leanness and lean efficiency have substantially decreased feed intakes(Ellis et al., 1983; Brandt, 1987; Cameron and Curran, 1994). Importation of seedstock has added genetic variation for lean growth, fat accretion and feed intake. Thirty percent differences in feed intake exist between different genotypes (Schinckel, 1994a).
Evaluation of Environmental Limitations
Environmental factors including disease exposure, social stress and less than optimal stocking density limit growth such that pigs managed under commercial conditions are unlikely to express their maximum potential protein accretion, even when allowed ad libitum access to a high quality nutrient dense diet. For this reason, the term operational protein accretion was introduced. The operational protein accretion is the maximum protein accretion rate that pigs can achieve under specified commercial conditions. This definition implies that, for a given genotype, the maximum achievable protein accretion potentials are limited by environmental conditions under which it is determined. Protein accretion curves can be used to estimate the magnitude in which environmental conditions (health status, facilities, stressors) limit the expression of the pigs genetic potential for lean growth. A substantial difference between on-farm and maximum achievable protein accretion or lean growth rates are indicative of major environmental limitations. In such cases, the commercial producer must evaluate the benefits and costs of environmental-management changes.
A trial recently evaluated the difference in growth of pigs raised under average commercial and optimal environmental conditions (Holck et al., 1997). Pigs weighed an average of 32.5 kg at 77 days of age. The barrows were blocked by weight and allotted to either a commercial grow-finish facility (.74 m2/pig, 24 pigs/pen, COMM) or a test station (2.23 m2/pig, 3 pigs/pen UNRES).
Table 1. Comparison of commercial versus optimal commercial conditions.
|
|
Environment |
|||
|---|---|---|---|---|
|
Commercial |
Optimal |
% Optimal/ Commercial |
P value |
|
Daily gain, kg/d |
.730 |
1.038 |
142 |
<.001 |
|
Days to 118 kg |
192 |
160 |
83 |
<.001 |
|
Daily fat-free lean gain, g/d |
240 |
342 |
142 |
<.001 |
|
Daily fat gain, g/d |
240 |
353 |
148 |
<.001 |
|
Daily feed intake, kg/d |
2.45 |
3.00 |
122 |
<.05 |
|
Feed/gain |
3.29 |
2.85 |
87 |
<.05 |
|
Feed/lean gain |
10.39 |
9.30 |
90 |
ns |
|
Backfat, cm |
2.48 |
2.74 |
112 |
ns |
(Holck et al., 1997)
Dramatic and significant (p<.0001) differences in bodyweight gain were observed between pigs raised in the two different environments. The least-square mean ADG from 30 to 120 kg bodyweight was .73 and 1.04 kg/day for the COMM and UNRES groups, respectively (Table 1). The UNRES group had significantly higher mean weights by two weeks after allotment compared to the COMM group and those differences in body weights were magnified during the growout period. The increased body weights consisted of both fat and lean gain.
Average daily gain showed a very small increase with live weight, reached a maximum (780 gm/day at 59.0 kg live weight in the commercial and 1070 gm/day at 42 kg live weight in the unrestricted environment) and decreased slightly as live weight increased (Figure 5). Pigs reared in the unrestricted environment immediately grew faster than pigs reared in the commercial environment. The advantage in live weight growth at each live weight was consistent during the finishing period.
The daily fat-free lean growth rates increased slightly from start of test to a maximum rate achieved at 52 kg live weight in both environments and then declined (Figure 6). The rate of decline from 52 kg to 120 kg live weight was greater for pigs reared in the commercial environment (311 to 162 g/day commercial environment vs. 391 to 282 g/d in the unrestricted environment). At 120 kg live weight, the commercial pigs achieved 52% of their maximum daily lean growth versus 72% for pigs reared under the unrestricted environment. The daily fat-free lean growth rates of the unrestricted pigs were substantially greater than the commercial pigs up to 35 days on test. Daily fat growth rates increased as live weight increased for pigs reared in either environment (Figure 7). Daily fat growth was consistently 50-60 g/day higher for the pigs reared under the unrestricted environment.
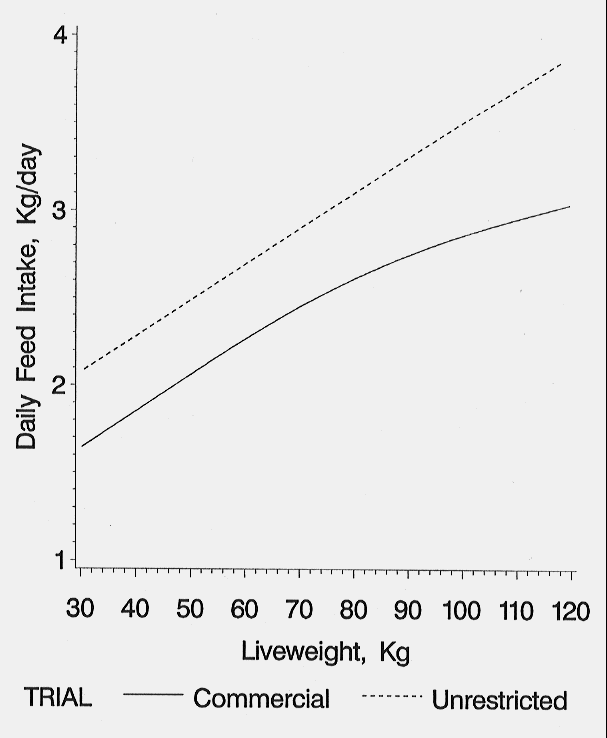
Feed disappearance increased almost linearly in the UNRES group with a feed intake of 3.74 kg/hd/day recorded during the final 2 weeks prior to slaughter. The increase in feed intake was not linear in the COMM group which experienced considerable variation, especially in the finishing building (Figure 8).
The unrestricted environment was designed to provide optimal physical (thermal, stocking density, feed/water access), social (pigs per pen, movement), and microbial (sanitation, segregation) conditions to minimize physiological and immunological stress. Performance of pigs raised in this environment was used as an estimate of genetic potential may be considered for this genotype. Differences in growth rates between pigs raised in commercial and unrestricted grow-finish environments were clearly demonstrated in this trial. The commercial environment reduced rate of live weight gain, lean and fat accretion to approximately 70% of the potential growth demonstrated in the unrestricted environment. While many researchers have shown performance differences of this magnitude using segregated-early-weaning techniques (Walker and Wiseman, 1993; Williams et al., 1994; Schinckel et al., 1995), it is important to note that in this research trial the pigs were not segregated pigs until 11 weeks of age.
Research conducted in two health status environments, medicated early weaning and continuous-flow commercial conditions, indicate that disease status affects lean growth to a greater extent than fat growth (Williams et al., 1993). Conventional health status pigs, although consuming less feed and growing more slowly, also had a lower percent lean than the SEW pigs.
Research in several species indicate that an animal's immune system response to disease organism antigens is a partial cause of reduced growth rates. Antigen induced cytokines cause a cascade of physiological changes including decreased growth hormone and insulin-like growth factor-1 (IGF-1). Segregated early weaned (SEW) pigs have lower plasma levels of cytokines, higher protein accretion rates, and higher IGF-1 levels (Hathaway et al., 1993; Williams et al., 1993; McComb et al., 1997; Van Kessel et al., 1997).
Table 2. Mean 95 day weights for commercial health, segregated early weaning (SEW), and segregated early weaning plus antigen treatments.
|
Treatment |
Live weight, lb |
Carcass weight, lb |
Thymus weight, g |
IGF-1, ng/ml |
TNFa |
|---|---|---|---|---|---|
|
Commercial |
93.4 |
76.4 |
71.4 |
50.5 |
61.6 |
|
SEW-control |
132.7 |
104.4 |
205.8 |
121.7 |
10.5 |
|
SEW+antigens |
127.5 |
102.6 |
203.2 |
114.4 |
37.1 |
Two trials have been conducted at to evaluate the differences between immune system activation and actual disease effects. The first trial utilized three treatments; 1) conventional commercial health status pigs managed continuous flow, 2) segregated early weaning, and 3) segregated early weaning with a series of vaccinations and lipopolysaccharides to produce the same antigen exposure as the commercial environment (Table 2). The antigenic challenges had approximately 13% of the effect on reduced growth as induced by disease in the commercial herd. Although designed to reflect commercial herd antigen exposure, the antigenic challenges to SEW pigs in the two trials did not reduce performance level to those observed in commercial production. The antigen treatments also did not cause any reduction in thymus gland weight or IGF-1 levels, although cytokine (TNFa ) levels were increased 50% the magnitude of the commercial herd - 11 days after the last antigen challenge. The second study was conducted to evaluate the impact of immune system activation on pig growth and carcass composition (Schinckel et al., 1995). Antigenic challenges were given at either moderate or more intense levels at times corresponding to commercial exposure to each disease based on titer levels from 10-84 days of age. Pigs of the three treatments, control, moderate, and intense antigen challenge, reached 230 lbs, at 136.6, 142.0, and 142.2 days and required 151.8, 155.6 and 156.0 days to 264 lbs. live weight.
All-in, all-out management (AIAO) and mycoplasmal pneumonia vaccination research also indicate that severity and/or duration of disease causes depressed growth and feed intake. In a Purdue study, AIAO pigs grew faster and more efficiently than the controls (Cline et al., 1992; P<.01). Average daily gain and days to 230 for the AIAO was .19 lb. more and eleven days less, respectively, than the control group. Ninety-four percent of the control pigs had lung lesions indicating the presence of pneumonia with an average of 15.1 percent of the lung infected. Fifty-two percent of the AIAO pigs had evidence of lesions with an average of 4.1 percent of the lung infected.
Research evaluating isolation-management procedures also indicate that the level of disease exposure and clinical signs of disease affect growth. Research was conducted in which pigs weaned at 4 weeks of age were assigned to one of three treatments; isolation at 4 weeks of age, isolation at 8 weeks of age to a continuous flow managed grow-finishing barn (Clark et al., 1991). Although mycoplasma titer levels were similar for the two 8 week treatments (isolation or disease exposure), the pigs exposed to more substantial disease exposure had substantially increased coughing (8 vs. 0 pigs of 16 per treatment), lung lesions (16 vs. 0), percent lung involvement (10.4 vs. 0%) and slower growth (138 vs.148 lb at 126 days of age).
A trial conducted with a mycoplasmal pneumonia vaccine (Respisure, SmithKline Beecham) also indicated that the duration and/or severity of disease affected pig growth (Scheidt, et al., 1992). One hundred-fifty pigs were randomly allocated to one of three treatments. Treatment 1 pigs were injected with a Mycoplasma hyopneumoniae vaccine at 7 and 21 days of age, treatment 2 pigs were vaccinated at 6 and 8 weeks of age, and treatment 3 pigs served as non-vaccinated controls. At two months of age, all pigs were moved into pens within a continuous-flow, growing-finishing facility. Twenty-one control pigs, 13 treatment 1 pigs, and 5 treatment 2 pigs were observed coughing between 2.5 and 5.5 months of age. Pigs in both vaccinated groups gained 7.7% more than the control pigs, (P<0.05) during the finishing phase. Days to 230 lb. for pigs in both vaccinated groups were 9 days less than control pigs. Pigs in both vaccinated groups consumed more feed (+7.9%) than the control pigs during the finishing phase.
Many investigations have used the amount of respiratory disease at slaughter as the measure to relate to pig performance, using radiographic studies, it was found that cumulative lifetime pneumonia was significantly correlated to live weight at 180 days of age (r2 = .42) so that every 1% increase in average lifetime pneumonia reduced 180 day weights by 3.22 pounds (Noyes et al., 1990). With 21 to 28 day weaning, many herds may have similar antibody levels but have different levels of disease. Stocking density, cubic feet of air space per pig, production system (continuous flow; all-in/all-out) and disease interactions (PRV, PRRS) likely all play a role in increasing the duration and severity of respiratory disease (Skirrow, 1993).
Based on these results and the results of others, it is likely that stress-immune system responses occurring when the animal is in a prepathological or pathological state reduce lean growth (protein accretion) and only partially explained by initial antigen exposure and recognition (Moberg, 1993). The decrease in performance due to disease is proportional to the length and intensity of pathogen exposure, and duration and intensity of disease pathology (Skirrow 1993).
Modeling the Effect of Social Interaction
Chapple (1993) measured and predicted performance in pigs housed in groups of 1, 3, and 5 pigs per pen from 20 to 100 kg bodyweight. Live weight growth declined (.89, .87, and .84 kg/d respectively), daily feed intakes declined (2.41, 2.30 and 2.19 kg/day) and P2 backfat increased (18.7, 20.1, and 21.7 mm respectively) with increased group size. Predicted daily protein accretion rates declined (132, 125, and 119 g/d respectively) while predicted fat deposition rates remained constant (251, 252, and 251 g/d respectively).
Recently, two trials have been conducted to evaluate the effects of group size on pig growth and composition (Frank et al., 1997). Pens were designed to maintain similar pen and feeder space per pig with group sizes of 1, 4, 8, 16 or 32 pigs per pen. Average initial and final pig weights were 25.7 and 108.5 kg. Average daily gain (ADG) and gain:feed (G/F) decreased (p<.02). ADG: 950, 905, 873, 888, 877 g/d; G/F: .444, .436, .420, .417 and .428; respectively for 1, 4, 8, 16, and 32 pigs per pen. Feed intakes were not significantly affected (2.14, 2.07, 2.08, 2.13 and 2.04 kg/day). Final fat depth increased with increasing group size (14.6, 15.3, 15.8, 16.4 and 16.5 mm for 1, 4, 8, 16 and 32 pigs/pen.
In a second trial, treatments of one or five pigs/pen were evaluated (Frank et al., 1997). Group size affected average daily gain (909 vs. 836 g/day for 1 vs. 5 pigs/pen). Also during the course of the trial, serum IGF-1 concentrations were higher for 1 vs. 5 pigs/pen.
It is the hypothesis of Chapple (1993) that the stressors associated with rearing pigs in groups is mediated through biochemical growth factors that down regulate lean tissue growth and reduce feed intake. The increased backfat thickness observed with increased group sizes indicates that the effect of group size can not be modeled as a depression in feed intake. The expectation of modeling the social effects only via reduced feed intakes is that daily fat growth and subsequent backfat thickness should decrease with decreased feed intakes. When in fact, pigs reared in larger groups (N = 16 to 32) with reduced feed intake, have reduced protein accretion (lean gain) and similar daily fat growth. Thus the ratio of lean:fat gain reared in larger group sizes are actually reduced.
Genetic by Environmental Interactions
Each commercial pork producer must evaluate the strengths and weaknesses of available genotypes. The difficulty in choosing the optimal genotype or genotypes is predicting the improvements on performance and profitability in the specific environmental-health status conditions, production costs and marketing system.
Pig growth is effected by a large number of genetic and environmental factors. The maximal genetic potential for lean growth (protein accretion) can be evaluated by rearing pigs under the most nonlimiting optimal environment possible including health status, pen density, group site and thermal environment. Genetic populations with different genetic potential for lean growth, partitioning of energy from fat to lean, feed (energy) intake and fat accretion may have different physiological regulators of growth which may effect how they respond to environmental stressors. From a modeling perspective, lean low feed intake genotypes would be expected to be more sensitive to any environmental stressor that reduces feed intake. From a physiological perspective, the genetic selection or lean growth rate or lean efficiency may have focused on the directing of nutrients to protein accretion. Thus, possibly the stress response of a low feed intake extremely lean genotype may be different than a high feed intake genotype with average leanness.
One trial examining possible interaction between immune system activation and genetic potential for lean growth has been conducted (Stahly et al., 1994). Sources of pigs with high and low genetic potential for lean growth were reared via segregated early weaning procedures. At 154 lb. live weight, pigs within each litter were randomly assigned to the control (no antigen - low immune system activation) or antigen challenged - high immune system activation (IS) treatment groups. The IS groups were injected with lipopolysaccheride (E. Coli - k 235) at 5 mg/kg in an oil-based (Narcol) adjuvant at the initiation and day 28 of the trial.
Carcass composition of the low lean growth pigs was not effected by the IS treatment. The high lean growth pigs had larger reductions percent muscle and muscle gain as a result of the IS treatment than the low lean growth genotype. Although feed intake was reduced by the IS treatment, the IS treatment resulted in increased backfat depth and reduced loin eye area, percent muscle (lean adjusted to 10% fat) and muscle gain. The IS response was greater in the high lean growth rate genotype than the low lean growth genotype (Stahly et al., 1994).
Table 3. Carcass characteristicsa
Item |
LG Genotype |
IS Status |
IS Status |
Change |
|---|---|---|---|---|
|
Backfat thickness, in.b - Tenth ribc |
Low |
2.07 |
2.04 |
+.04 |
|
|
High |
.73 |
1.08 |
+.35 |
|
LEA, in. 2bc |
Low |
2.66 |
2.62 |
-.04 |
|
|
High |
7.18 |
6.30 |
-.88 |
|
Est. muscle, %b |
Low |
40.6 |
40.5 |
-.1 |
|
|
High |
61.8 |
57.5 |
-4.3 |
|
Muscle gain, lb/dc |
Low |
.37 |
.32 |
-.05 |
|
|
High |
.82 |
.58 |
-.24 |
a Five pigs/trt mean.
b Data adjusted for final weight.
c IS* genotype effect (P<.13).
The second trial evaluating genotype by environmental interactions was recently conducted at Purdue University (Frank et al., 1997; McComb et al., 1997). Two genotypes were reared under two health-management conditions. The two health-management treatments were segregated early weaning-three site production (EW) verses conventional 28-day weaning with continuous flow grow-finish management (CF). One genotype was European Terminal cross (ETS) which had a high genetic potential for lean growth, moderate to low feed intake and high percent lean. The second genotype was a York-Landrace cross (YL) and had average genetic potential for lean growth, feed intake, and percent lean.
Two hundred eighty-eight 10-14 day old pigs from the subject herd were randomized by litter, sex, and weight into either the segregated early weaned group or the continuous flow group. There were 24 pens of pigs in each health status-management environment. In each health status environment, 12 pens were allocated to each genotype with 6 pens were assigned pigs of the same genotype and sex. These 6 pens were then assigned either a control diet or a diet that contained antibiotics for the remained of the trial. At farrowing, each litter had 4 pigs (2 barrows and 2 gilts) cross-fostered with another litter of the same genotype. One sow (nurse litter) was conventionally weaned and the other early weaned. This allowed equal representation of littermates in both health status environments.
The 14-day old pigs were weaned and moved to an isolated early wean facility and reared until eight weeks old. The eight week old pigs were then placed in a curtain-sided building that had been previously emptied, cleaned, and disinfected. Pigs stayed in this facility until they weighed approximately 250 pounds at which time they were taken to slaughter.
Twenty eight-day old littermate pigs were weaned and placed in an all-in/all-out nursery. They remained in the nursery until they were eight weeks old. At that time, they were placed in a continuous flow finisher. They remained there until they weighed approximately 250 pounds when they were taken to slaughter.
The pigs were weighed and feed consumption recorded bi-weekly in the nursery and every 3 weeks in grow-finish until near market weight, when pigs were weighed weekly. Tenth rib backfat (10th Rib BF), loin muscle area (LEA), and warm carcass weight were obtained at a pork processor (IBP, Logansport, Indiana). These values were then used to calculate percent lean (5% fat) using equations provided in Procedures to Evaluate Market Hogs (NPPC, 1991). Data was analyzed as a factorial arrangement of health status-management, sex, genotype, and antibiotic treatments. The analysis of main effects and interactions were conducted using GLM (SAS).
In the nursery, the EW pigs (Table 3) had higher ADG than CF pigs (Table 4: P<.01). There was also a treatment effect in the nursery. Medicated pigs regardless of their environment had higher ADG (P<.001) and higher ADFI (P<.05). Medicated pigs in the CF nursery also showed a greater response than the EW pigs (P<.01). This caused the subsequent variation in the end of nursery weights. The EW pigs were 3.25 pounds heavier than the CF pigs (P<.01) at 56 days of age and the medicated pigs were nearly 4 pounds heavier than those pigs fed the control diets (P<.01).
From day 53 to day 101, the EW pigs had higher ADG and ADFI (P<.001). During this same period, barrows had higher ADG (P<.05) and ADFI (P<.01) than gilts. It was also found that the YL pigs had higher ADFI than the ETS pigs (P<.001), which was to be expected. Barrows had higher ADFI than gilts from day 101 to day 142 (P<.01), but did not have higher ADG. The ETS pigs were gaining approximately 0.25 pounds more per day than the YL pigs (P<.001) during this same time period.
The EW pigs had statistically higher ADFI than the CF pigs (P<.01). Barrows were consuming more feed than gilts (P<.001) and the YL pigs in both environments had higher ADFI than the ETS pigs (P<.01).
ETS pigs reached market weight faster than the YL pigs (P<.01). There was no statistical difference in days to market between the two environments. At approximately day 85, pigs in the EW environment became serologically positive for diseases involved the Porcine Respiratory Disease Complex (PRDC) SIV Mycoplasma and PRRS. The greatest effects of the disease can be found in ADG from days 101 to 142 days. During this period in the EW environment, ADG went down from days 53 to 101, however, ADFI continued to rise.
The differences in death loss were highly significant (P<.001). Pigs in the CF environment had an average death loss percent of 12% versus the EW pigs at 3.2%. In this case, antibiotic treatment did not have a significant effect on death loss in the CF environment. On average, the ETS pigs had a higher death loss percent as compared to the YL pigs (P<.05). The death loss of the ETS pigs in the CF environment was 18.5% versus 5.6% for the YL pigs. Antibiotic treatment reduced death loss in the EW environment.
Loin eye areas (LEA) of the gilts were larger than the barrows (7.31 versus 6.35 in.2; P<.001). ETS pigs had larger LEA (7.47 versus 6.01 in.2; P<.001) and less backfat (0.66 vs. 0.96 in.; P<.001) than YL pigs. The 10th rib backfats of the EW pigs were larger than the CF pigs (0.84 vs. 0.78 in.; P <.01). This difference was likely caused by the YL pigs in the EW environment overconsuming energy in the last phase of the finisher resulting in increased fat deposition. The changes in LEA and backfat thickness account for the differences in percent lean measurement.
Significant genotype x environment interactions existed for growth rate (ADG 53-101, 101-142 days of age), days to market weight, backfat thickness percent lean and death loss. The difference in percent lean between the ETS and YL barrows were 6.5% in the EW environment and 5.0% in the CF environment. The difference in percent lean between the ETS and YL gilts were 8.8% in the EW environment and 5.2% in the CF environment. Significant environment by sex and sex by genotype interactions were also significant for measures of growth rate and carcass leanness.
Table 4. Early wean - 3 site growth performance, carcass characteristics, and pork quality
Environment |
EW |
|
|
|||
|---|---|---|---|---|---|---|
|
Genotype |
ETS |
YL |
|
|
||
|
Sex |
Barrows |
Gilts |
Barrows |
Gilts |
C.V. |
Signif.b |
|
ADG, lb/day |
|
|
|
|
|
|
|
d 0 - d 53 |
.72 |
.76 |
.79 |
.78 |
8.64 |
E** T*** ExT** |
|
d 53 - d 101a |
1.50 |
1.46 |
1.54 |
1.44 |
7.24 |
E*** S* ExG+ GxT+ |
|
d 101 - d 142a |
1.39 |
1.33 |
1.31 |
1.26 |
11.1 |
G*** T* ExG*** ExS+ |
|
d 142 - marketa |
1.75 |
1.47 |
1.83 |
1.60 |
11.2 |
S* ExS* ExT* |
|
Nursery Weight, lb |
39.4 |
39.3 |
41.99 |
40.56 |
10.2 |
E** T** |
|
Days to Market |
187.3 |
194.7 |
183.7 |
195.5 |
2.80 |
S* G** ExS*** ExG*** |
|
Slaughter Wt., lb |
253.1 |
247.1 |
249.0 |
248.3 |
1.40 |
E*** S** ExT*** G+ T+ |
|
Deathloss, % |
2.4 |
4.8 |
2.8 |
2.8 |
118 |
E** G* ExG* ExSxT+ |
|
LEAd, in2 |
6.96 |
8.32 |
5.78 |
6.23 |
6.80 |
S*** G*** SxG* ExT+ |
|
10th Rib BFd, in |
.77 |
.52 |
1.18 |
.89 |
9.32 |
E** S*** G*** ExG** ExS+ |
|
Leand, % |
54.5 |
60.6 |
48.0 |
51.8 |
3.01 |
S** G*** ExG* |
a Values adjusted for nursery (d 53) weight.
b Significance P-values: *p<.05, **p<.01, ***p<.001, +p<.10; E=Environment, G=Genotype, S=Sex, T=Treatment, x=Interaction.
d Values adjusted for Market Weight.
Table 5. Continuous flow growth performance, carcass characteristics, and pork quality
|
Environment |
CF |
|
|
|||
|---|---|---|---|---|---|---|
|
Genotype |
ETS |
YL |
|
|
||
|
Sex |
Barrows |
Gilts |
Barrows |
Gilts |
C.V. |
Signif.b |
|
ADG, lb/day |
|
|
|
|
|
|
|
d 0 - d 53 |
.70 |
.70 |
.73 |
.71 |
8.64 |
E** T*** ExT** |
|
d 53 - d 101a |
1.47 |
1.34 |
1.31 |
1.30 |
7.24 |
E*** S* ExG+ GxT+ |
|
d 101 - d 142a |
1.41 |
1.63 |
1.12 |
1.13 |
11.1 |
G*** T* ExG*** ExS+ |
|
D 142 - marketa |
1.80 |
1.86 |
1.74 |
1.71 |
11.2 |
S* ExS* ExT* |
|
Nursery Weight, lb |
35.8 |
37.2 |
37.7 |
37.1 |
10.2 |
E** T** |
|
Days to Market |
186.6 |
182.8 |
198.0 |
197.3 |
2.80 |
S* G** ExS*** ExG*** |
|
Slaughter Wt., lb |
247.4 |
246.4 |
246.5 |
242.5 |
1.40 |
E*** S** ExT*** G+ T+ |
|
Deathloss, % |
15.9 |
21.0 |
5.6 |
5.6 |
118 |
E** G* ExG* ExSxT+ |
|
LEAd, in2 |
6.87 |
7.76 |
5.79 |
6.23 |
6.80 |
S*** G*** SxG* ExT+ |
|
10th Rib BFd, in |
.74 |
.60 |
1.00 |
.77 |
9.32 |
E** S*** G*** ExG** ExS+ |
|
Leand, % |
54.7 |
58.4 |
49.7 |
53.2 |
3.01 |
S** G*** ExG* |
a Values adjusted for nursery (d 53) weight.
b Significance P-values: *p<.05, **p<.01, ***p<.001, +p<.10; E=Environment, G=Genotype, S=Sex, T=Treatment, x=Interaction.
d Values adjusted for Market Weight.
It is widely accepted that genetic populations expressing heterosis are generally less sensitive to environmental changes and stressors than inbred genetic groups (Bichard and Smith, 1972; Barlow, 1981). In pigs, the improvement in days to 90 kg as a result of heterosis (Yorkshire-Landrace cross vs. purebred Yorkshire and Landrace) was found to become smaller as the health classification improved (Kennedy and Quinton, 1987; -2.7, -1.5 and -.3% for basic, good and excellent health). The purebred Yorkshire and Landrace were more sensitive to the health status classification than the Yorkshire-Landrace crossbred pigs.
References
Barlow, R. 1981. Experimental evidence for interaction between heterosis and environment in animals. Anim. Breed Abst. 49:715-737.
Bichard M. and W. C. Smith. 1972. Crossbreeding and genetic improvement. In Pig Production (ed D.J.A. Cole), p. 37-52. Butterworths, London.
Brandt, H. 1987. Development and genetic aspects of feed intake in three breeds of pigs at German test stations and measures to prevent further deterioration. Pig News and Information. Vol. 8 (No. 1):29.
Cameron, N.D. and M.K. Curran. 1994. Selection for components of efficient lean growth in pigs. 4. Genetic and phenotypic parameter estimates and correlated responses in performance traits with ad-libitum feeding. Anim. Prod. 59:281.
Chapple, R.P. 1993. Effect of stocking arrangement of pig performance. Manipulating Pig Production IV. p. 87-97.
Clark, L.K., A.B. Schedit, C.N. Armstrong, K. Knox and V.B. Mayrose. 1991. The effect of all-in/all-out management on pigs from a herd with enzootic pneumonia. Vet. Med. 86:946.
Cline, T.R., V.B. Mayrose, A.B. Scheidt, M.A. Diekman, L.K. Clark, C.S. Hurt, and W.L. Singleton. 1992. Effect of all-in/all-out management on the performance and health of growing-finishing pigs. 1994 Purdue Swine Day Report. p.9-12.
de Lange, C.F.M. and H.W.E. Schreurs. 1995. Principles of model application. In (Moughan, P.J., M.W.A. Verstegen and M.I. Visser-Reyneveld Eds.): Modeling Growth in the Pig. Wageningen Pers, Wageningen, The Netherlands. p. 187.
de Lange, C.F.M., S. Mohn and M. Nyachoti. 1995. Partitioning of energy and protein intake in grower-finisher pigs. In (Ed. M. Ivan) Anim. Sci. Res and Dev. Proc. 1996 Can. Soc. Of Anim. Sci. Ottawa, Canada. p. 339.
Ellis, M., W.O. Smith, R. Henderson, C.T. Whittemore and R. Laird. 1983. Comparative performance and body composition of control and selection lines of large white pig. 2. Feed to appetite for a fixed time. Anim. Prod. 36:407.
Frank, G.R., M.E. Spurlock, S.G. Cornelius, G.M. Willis and M. McComb. 1997. Effects of group size on performance, fat depth and serum concentrations of insulin-like growth factor-1 in grow-finishing pigs. J. Anim. Sci. Vol. 75(Suppl. 1):37(abstr.).
Frank, J.W., B.T. Richert, A.P. Schinckel, B.A. Belstra and A.L. Grant. 1997. Environmental effects on genetic potential for lean gain. J. Anim. Sci.(Suppl. 1):38(abstr.).
Friesen, K.G., J.C. Nelssen, R.D. Goodband, M.D. Tokach, A.P. Schinckel, and M.E. Einstein. 1996. The use of growth curves for assessing the response to dietary lysine by high-lean gain gilts. Anim. Sci. 62:159.
Hathaway, M.R., W.R. Dayton, B. Wiseman, T. Molitor and M.E. White. 1993. Effect of weaning pigs at 10 days to off-site clean nurseries on growth rate, IGF-1 levels and serum mitogenic activity. J. Anim. Sci. 71(Suppl. 1, abstr.);43.
Holck, J.T., A.P. Schinckel, J.L. Coleman, V.M. Wilt, E.L. Thacker, M. Spurlock, A.L. Grant, P.V. Malven, M.K. Senn and B.J. Thacker. 1997. Environmental effects on the growth of finisher pigs. Vol. 75(Suppl. 1):246(abstr.).
Kennedy, G.W. and M. Quinton. 1987. A note on the effects of health environment on heterosis for growth rate in pig. Anim. Prod. 44:443-445.
McComb, M.A., J.W. Frank, A.P. Schinckel, M.E. Spurlock, B.T. Richert, P.J. Malven and A.L. Grant. 1997. J. Anim. Sci. Vol. 75(Suppl. 1):85(abstr.).
Moberg, G.P. 1993. A review-developing management strategies to reduce stress in pigs: a new approach utilizing the biological cost of stress. In Manipulating Pig Production IV. (E.W. Butterham, Ed.) Aust. Pig Sci. Assoc. Ahwood, Victoria, Aust. p. 116.
Noyes, E.P., A. Feeney and C. Pijoan. 1990. Comparison of the effect of pneumonia detected during lifetime with pneumonia detected at slaughter on growth in swine. J. Amer. Vet. Med. Assoc. Vol. 197:1025-1032.
Scheidt, A.B., V.B. Mayrose, W.G. VanAlstine, L.K. Clark, T.R. Cline, and M.E. Einstein. 1992. The benefit cost of vaccinating pigs for mycoplasmal pneumonia. 1994 Purdue Swine Day Report. p.13.
Schinckel, A.P. 1994a. Nutrient requirements of modern pig genotypes. In (Garnsworthy, P.C. and D.J.A. Cole Ed.): Recent advances in animal nutrition. Univ. of Nottingham Press, Nottingham, U.K. p.133.
Schinckel, A.P. 1994b. The minimum number of traits for an accurate description of growth. In: Proc. 5th World Cong. On Genetics Appl. Livest Prod. Univ. of Guelph, Guelph, Canada. 19:177.
Schinckel, A.P., L.K. Clark, G. Stevenson, K. Knox, J. Nielsen, A. Grant, J.J. Turek and D. Hancock. 1995. Effects of antigenic challenge on growth and composition of segregated early-weaned pigs. Swine Health and Production 3(6):228-234.
Schinckel, A.P., P.V. Preckel and M.E. Einstein. 1996. Prediction of daily protein accretion rates of pigs from estimates of fat-free lean gain between 20 and 120 kilograms live weight. J. Anim. Sci. (74:498).
Schinckel, A.P. and C.F.M. de Lange. 1996. Characterization of growth parameters needed as inputs for pig growth models. J. Anim. Sci. 74:2021.
Skirrow, S.Z. 1993. Effects of stocking arrangements on respiratory disease on pigs. In Manipulating Pig Production IV (E.S. Batterham Ed.). Aust. Pig Sci. Assoc. Ahwood Victoria, Aust. p. 98.
Smith, J.W. II, Tokech, M.D., Schinckel, A.P., Dritz, S.S., Nelssen, J.L. and R.D. Goodband. Farm specific modeling of growth, protein and fat accretion and nutrient requirements of finishing pigs on commercial swine farms. J. Anim. Sci. Vol 75 (Suppl. 1):48 (abstr.).
Stahly, T.S., N.H. Williams and S.G. Swenson. 1994. Interactive effects of immune system activation and lean growth genotype on growth of pigs. Iowa State Univ. 1994 Swine Research Reports. p. 33-35.
Thompson, J.M., F. Sun, T. Kuczek, A.P. Schinckel and T.S. Stewart. 1996. The effect of genotype and sex on the patterns of protein accretion in pigs. Anim. Sci. G3:265-276.
Van Kessel, A.G., A. Estrada, J.F. Patience, M. Tang and B. Coarveld. 1997. Toward defining the physiological and immunological mechanisms mediating improved performance in site-segregated early weaned pigs. J. Anim. Sci. 75(Suppl. 1):169(abstr.)
Walker, R. and Wiseman, B.A. 1993. Comparison of off-site early weaned and conventionally weaned pigs from weaning to market. Recent Advances in Swine Production and Health. Univ. of Minn. Vol 3:10-17.
Williams, N.H., T.S. Stahly, and D.R. Zimmerman. 1993. Impact of immune system activation and dietary amino acid regimen on nitrogen retention of pigs. J. Anim. Sci. 71(Suppl. 1):171.
Williams, N.H., Stahly, T.S. and Zimmerman, D.R. 1994. Impact of immune system activation on growth and amino acid needs of pigs from 6 to 114 kg body weight. J. Anim. Sci. 72 (Suppl. 2):57 (abstr.).
Figure 1. Protein accretion for barrows of four genotypes.

Figure 2. Predicted daily protein accretion rates for three genotypes at 53 kg live weight3/4 50 kg empty body weight at different energy intakes. Maximum daily protein accretion rates of 110, 150 and 150 g, slope of protein accretion (g) per Mcal ME intake of 21.3, 24.8 and 28.3.
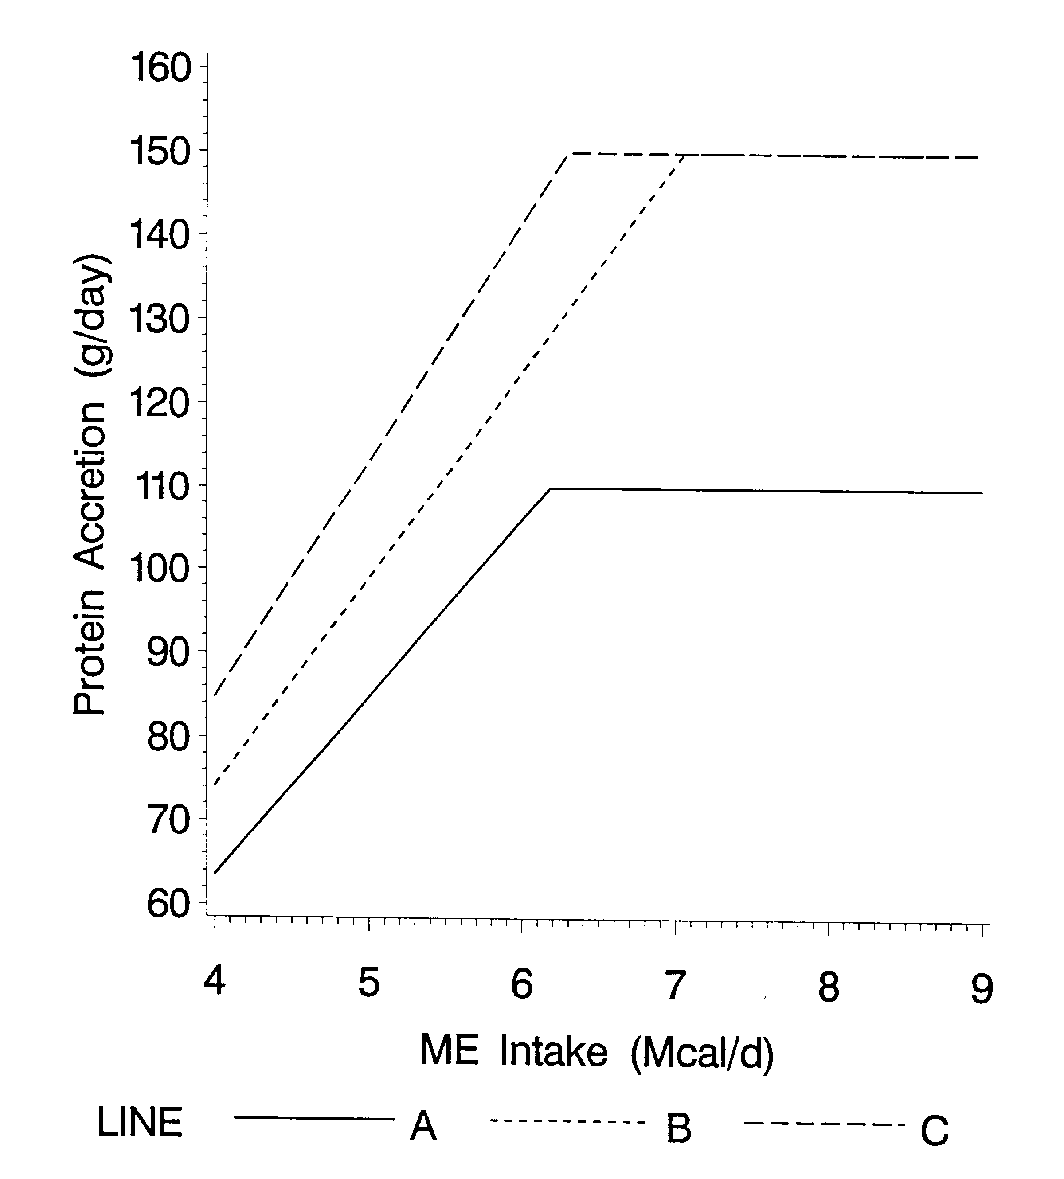
Figure 3. Daily lipid accretion rates at different energy intakes.
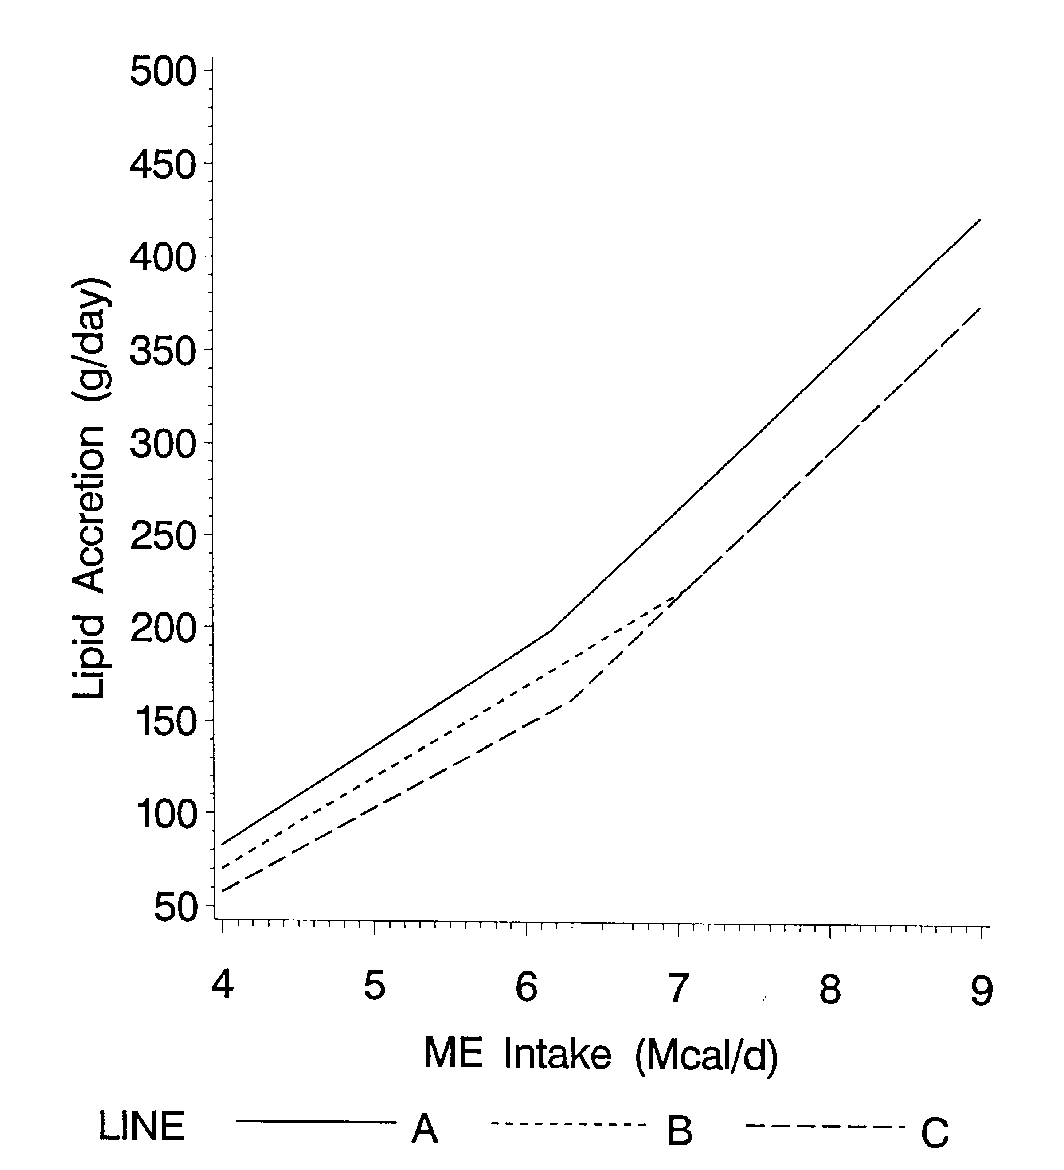
Figure 4. Ratio of lipid gain to protein gain at different energy intakes.
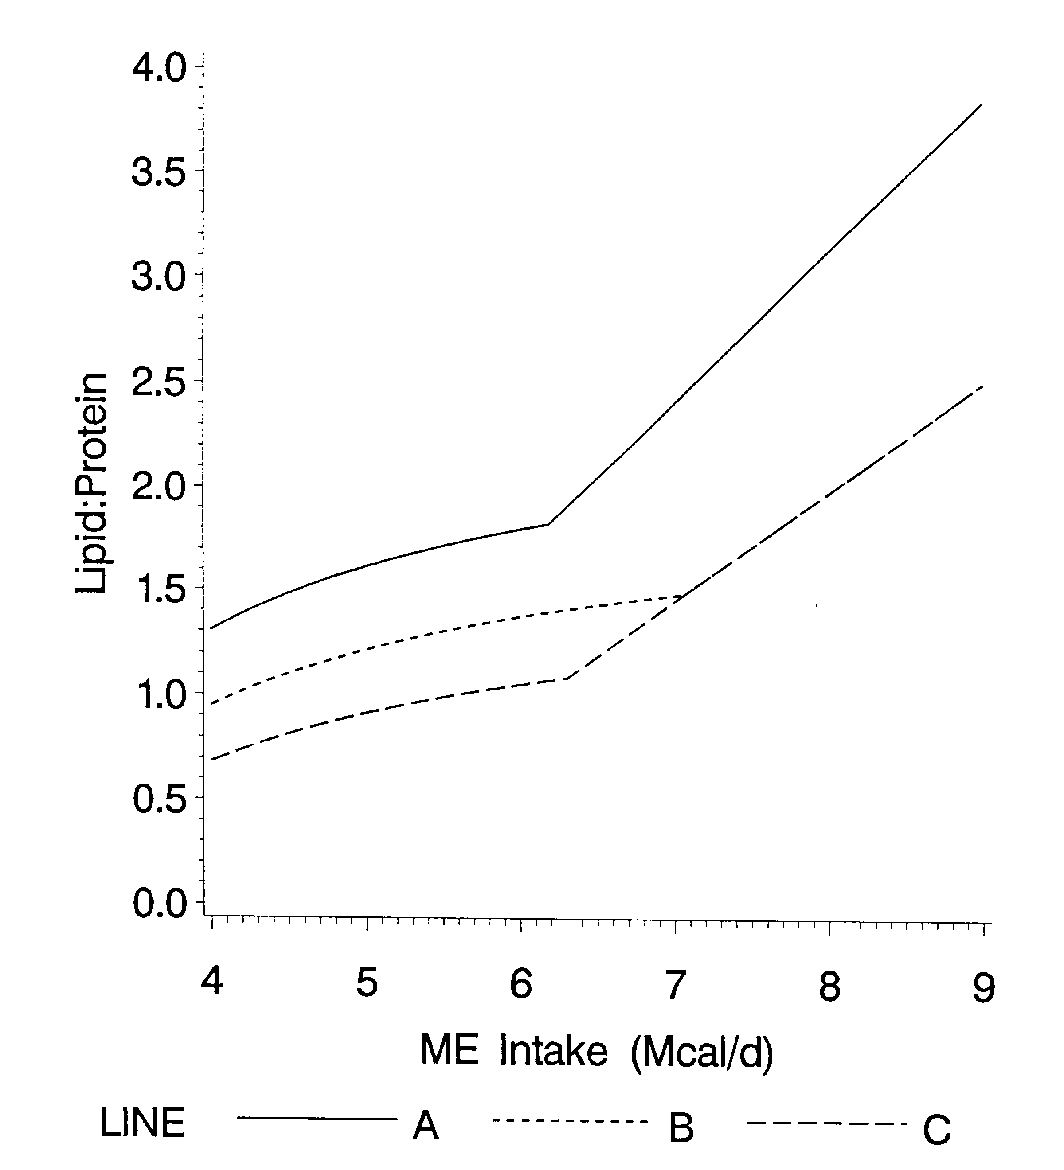
Figure 5. Average daily gain for 30-120 kg in the environments (Holck et al., 1997).
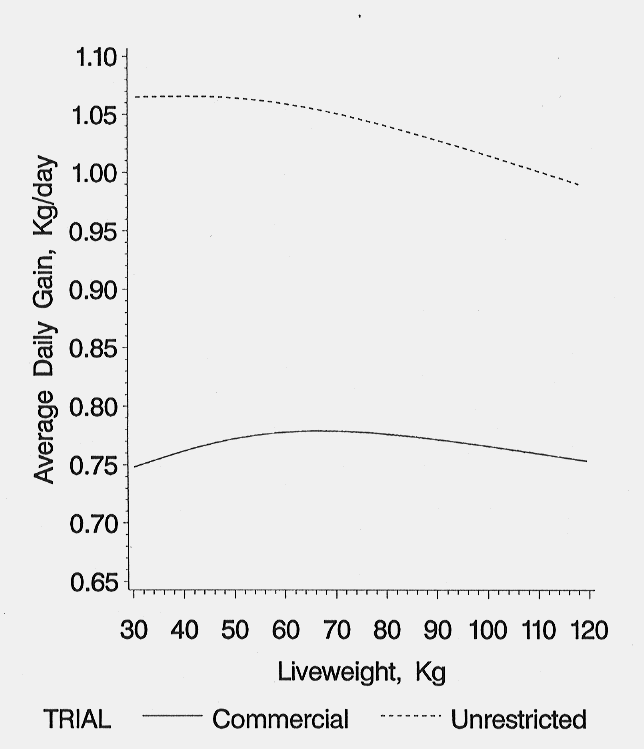
Figure 6. Daily fat-free lean growth rates of pigs reared in two environments (Holck et al., 1997).
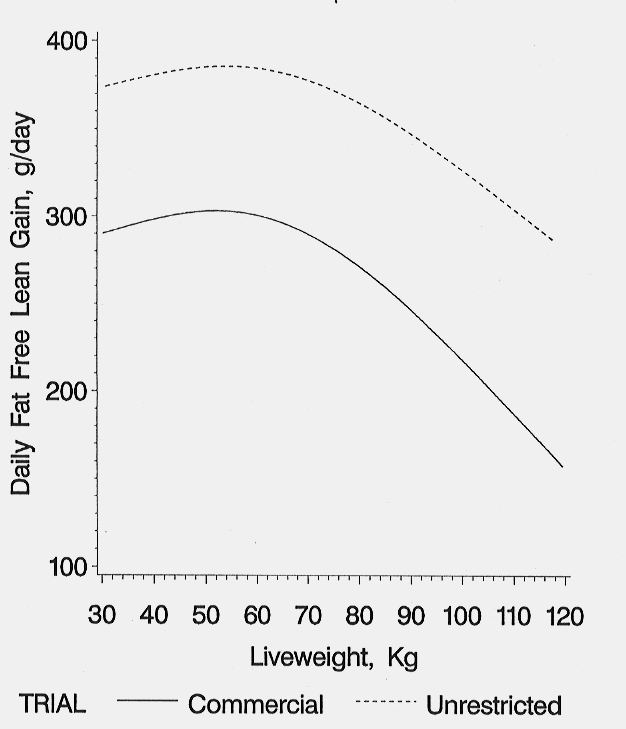
Figure 7. Daily fat gain of pig reared in two environments (Holck et al., 1997).
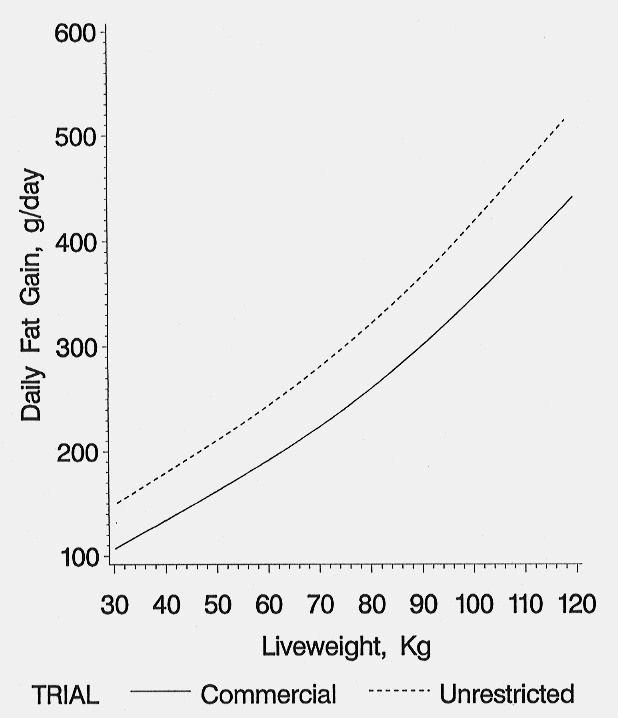
Figure 8. Daily feed intake of pigs reared in two environments (Holck et al., 1997).
Purdue Pork Page Archive