J. P. Rice1, R. S. Pleasant2,
and J. S. Radcliffe1
1Department of Animal Sciences
2Virginia-Maryland Regional College of Veterinary Medicine, Blacksburg,
VA.
Introduction
Organic acids have been supplemented to weanling pig diets in an attempt to improve post-weaning lag. Organic acids have proved beneficial in improving average daily gain (ADG) and increasing nutrient digestibility (Falkowski and Aherne, 1984; Edmonds et al., 1985; Geisting and Easter, 1985). There has also been interest in acidifying grower pig diets in an attempt to increase ADG and improve feed efficiency, but results are variable. Some studies report positive effects on ADG and feed efficiency (Jongbloed et al. 1996; Kirchgessner and Roth, 1989; Kirchgessner and Roth, 1990) while others do not (Thacker and Bowland, 1980).
Typically, a decrease in stomach pH is observed with acid addition (Sciopioni et al., 1978; Radcliffe et al., 1998; Burnell et al., 1998; Rice et al., 1999). However, the majority of reported research on stomach pH provides data taken at only one point in time, at slaughter, and it is difficult to understand the effects of acid on stomach pH over time or the stress of slaughter influencing stomach pH.
There has been recent interest in combining acid and phytase to investigate possible interactive effects. Microbial phytase has two optimal peaks of activity at pH 2.5 and 5.5 (Simmons et al., 1990), and the stomach pH of a pig varies from 1.0 to 4.5 (Chesson, 1987). Phytase activity changes along the digestive tract, with the most efficient hydrolysis of phytate by phytase occurring in the stomach (Yi and Kornegay, 1996; Mroz et al., 1997). It is hypothesized that by adding acid and phytase in combination, the stomach pH would decrease and create a more optimal environment for enzyme activity. It also seems plausible that by acidifying the diet, gastric emptying might be slowed, which in turn would alter nutrient digestibility. However, research in this area is scarce.
Our objectives were to determine the effects of organic acids alone or in combination with phytase on stomach pH over time, rate of digesta passage, and nutrient digestibility.
Materials and Methods
Animals, housing, and management. Eight crossbred barrows were surgically fitted with steered ileo-cecal valve cannulas (SICV) and percutaneous endoscopic gastrostomy (PEG) tubes at approximately 77 and 86 lb body weight (BW), respectively. The experiment consisted of a replicated 4 x 4 Latin square design. Pigs were housed individually, allowed ad libitum access to water, and feed was supplied at 9% of metabolic BW (BW.75) per day. Pigs were fed twice daily at 0600 h and 1800 h. Diets were corn-soybean meal based with the addition of Cr2O3 as an indigestible marker. Table 1 shows the composition of the 4 dietary treatments. Diet 1 served as the negative control with 0.53% Ca and 0.39% available P (aP). Diet 2 was Diet 1 with the addition of 3.0% citric acid. Diet 3 was Diet 1 with the addition of 454 U of phytase/lb of diet, and Diet 4 was Diet 1 with the addition of 3.0% citric acid and 454 U of phytase/lb of diet.
Each two-week period of the study consisted of a 7-d adjustment period, a 3-d total collection of urine and feces, a 12 hour ileal collection, a 3-d re-adjustment period, and a second 12 hour ileal collection. During the ileal collections, stomach pH was recorded every minute using a flexible gastrointestinal pH probe attached to a portable pH meter with a built-in data logger. The pH probe and temperature probe were inserted through the lumen of the stomach cannula. During the 12-h ileal collections, digesta from the SICV cannula was emptied every hour, placed on dry ice, weighed, and then placed in an ultra low freezer (-80°C). Ileal digesta samples were freeze dried and analyzed for P, Ca, Cr, and dry matter (DM). Feces and urine were collected twice daily during each three-day collection period and pooled by pig. Fecal samples were dried in a forced air oven at 60°C and analyzed for Ca, P, Cr, and DM content. Urine was collected and pH was measured. Ileal samples were freeze dried and analyzed for Ca, P, Cr, and DM content. Feed was analyzed for Ca, Cr, P, and DM.
Statistical analysis. Data were analyzed using the GLM procedure of SAS (1990). Pig served as the experimental unit. The model included pig, period, acid, phytase and the interaction of acid and phytase.
Results and Discussion
Growth performance. �Pigs recovered from both surgeries, remained healthy, and consumed all their food throughout the trial. Average daily gain was numerically better for pigs fed diets containing phytase, but these results were not significant (Table 2). Feed intake was similar for all diets since pigs were limit fed at 9% of metabolic BW. An improvement in feed efficiency (P < 0.05) was observed when phytase was added to the diet (0.326 vs. 0.342). There were no significant effects (P > 0.10) of acid or phytase addition on water consumption, although pigs fed diet 1 did numerically consume more water. The addition of 3.0% citric acid to the diet decreased urine pH from 4.56 to 3.58 (P < 0.10). The addition of phytase to the diet also decreased urinary pH from 4.55 to 3.58 (P < 0.10). Urine volume decreased upon acid addition to the diet (P < 0.10). Pigs consuming the diets with no acid averaged 1.06 gal. of urine output per day while those consuming the acidified diets produced 0.69 gal. of urine per day on average. There were no interactions of phytase and acid on any performance data.
Apparent ileal digestibilities. The apparent ileal digestibilities (AID) of Ca, P, and DM are shown in Table 3. In agreement with previous findings, the addition of phytase to the diet increased P (P < 0.001) and Ca (P < 0.05) AID. Dry matter AID was not affected. Citric acid addition did not affect (P > 0.10) P AID, but decreased Ca AID (P < 0.005) and increased DM AID (P < 0.05). An interaction of phytase and citric acid was observed for DM AID (P < 0.001). When acid was added to the diet without phytase, an increase in DM AID was observed. However, when acid was added to the diet containing phytase, no change in DM AID was observed.
Apparent total tract digestibilities. Table 4 displays the apparent total tract digestibilities (ATTD) of Ca, P, and DM. Phosphorus ATTD increased (P < 0.001) from 58.45 to 73.52% upon phytase addition to the diet. The ATTD of Ca increased from 49.52 to 60.67% (P < 0.001) when phytase was added, but no effects were observed for DM ATTD. Citric acid addition did not affect P or Ca ATTD (P > 0.10) but did increase DM ATTD (P < 0.001). There were no significant phytase x acid interactions observed for ATTD (P > 0.10).
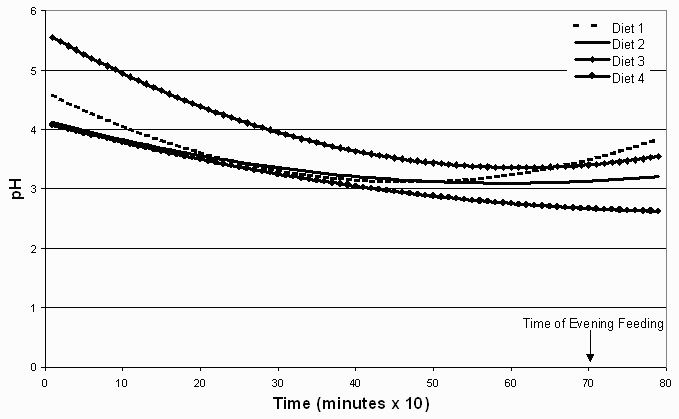
Effects of acid and phytase on stomach pH. The effects of dietary treatment on stomach pH are shown in Table 2 and Figure 1. There was an interaction of acid and phytase on average stomach pH. The addition of 3.0% citric acid alone reduced stomach pH (P < 0.001) from 3.71 to 3.07. Phytase addition to the diet, with no added acid, increased stomach pH (P < 0.001) from 3.29 to 3.49. However, when phytase was added to the diet containing 3.0% citric acid, stomach pH decreased to 3.02 (P < 0.001).
Stomach pH was monitored for 13 hours, beginning at the morning feeding (0600)
and continuing one hour after the evening feeding (1700). This recording time
allowed for the observation of daily fluctuations in gastric pH (Figure 1).
A similar pattern was observed across all dietary treatments in that gastric
pH was initially higher in the first few hours post-feeding and decreased slowly
over the course of the 13-hour recording time. An hour effect was observed
(P < 0.001) in that pH decreased over the 13 hours for all dietary treatments.
However, there was no interaction of diet and time observed (P > 0.10) on
stomach pH. Across all dietary treatments, gastric pH averages for the day ranged
between 3.02 and 3.95 with an average of 3.39. However, for individual pigs,
the range over the course of the day was from 1.7 to 4.9 (Figure 1).
In summary, citric acid addition decreased dietary pH which in turn decreased stomach pH. Acid addition decreased Ca AID and increased DM AID and ATTD but did not effect P digestibility. Phytase inclusion in the diet increased stomach pH and P and Ca AID and ATTD. An interaction of acid and phytase was observed for stomach pH and DM AID.
Implications
Phosphorus and Ca digestibility are increased when microbial phytase is added to grower pig diets. Adding citric acid to grower pig diets increases DM digestibility and decreases stomach pH and urinary pH. Feeding acid and phytase in combination does not lead to an interaction to increase P and Ca digestibility beyond phytase alone.
Table 1. Composition of the 4 dietary treatments
|
Diet |
||||
|
Item |
1 |
2 |
3 |
4 |
|
|
||||
|
Corn |
73.55 |
73.55 |
73.67 |
73.67 |
|
SBM |
20.92 |
20.92 |
20.91 |
20.91 |
|
Limestone |
0.88 |
0.88 |
0.88 |
0.88 |
|
Corn Oil |
0.63 |
0.63 |
0.58 |
0.58 |
|
Salt |
0.20 |
0.20 |
0.20 |
0.20 |
|
Vit. Premixa |
0.15 |
0.15 |
0.15 |
0.15 |
|
TM Premixb |
0.05 |
0.05 |
0.05 |
0.05 |
|
Cr-Premixc |
0.20 |
0.20 |
0.20 |
0.20 |
|
Citric Acid |
0.00 |
3.00 |
0.00 |
3.00 |
|
Natuphos |
0.00 |
0.00 |
0.06 |
0.06 |
|
Sand |
3.13 |
0.13 |
0.00 |
0.00 |
|
|
||||
|
CP |
15.36 |
15.36 |
15.36 |
15.36 |
|
Lys |
0.800 |
0.800 |
0.800 |
0.800 |
|
Met |
0.276 |
0.276 |
0.276 |
0.276 |
|
Cys |
0.290 |
0.290 |
0.291 |
0.291 |
|
Met+Cys |
0.566 |
0.566 |
0.566 |
0.566 |
|
Trp |
0.195 |
0.195 |
0.195 |
0.195 |
|
Thr |
0.576 |
0.576 |
0.576 |
0.576 |
|
Val |
0.748 |
0.748 |
0.748 |
0.748 |
|
Ile |
0.640 |
0.640 |
0.640 |
0.640 |
|
Leu |
1.454 |
1.454 |
1.455 |
1.455 |
|
Arg |
0.999 |
0.999 |
0.999 |
0.999 |
|
Phe |
0.795 |
0.795 |
0.795 |
0.795 |
|
His |
0.435 |
0.435 |
0.435 |
0.435 |
|
DE, kcal/lb |
1487.50 |
1487.50 |
1487.50 |
1487.50 |
|
Ca |
0.450 |
0.450 |
0.450 |
0.450 |
|
P |
0.405 |
0.405 |
0.405 |
0.405 |
|
Available P (aP) |
0.119 |
0.119 |
0.119 |
0.119 |
|
Na |
0.100 |
0.100 |
0.100 |
0.100 |
a Supplied per kilogram of diet: 6600 IU of Vitamin A, 472 IU of
Vitamin D3, 15.8 IU of Vitamin E, 2.2 mg of Vitamin K, 3.95 mg of
riboflavin, 19.83 mg D Pantothenic Acid, 26.4 mg of niacin, 0.017 mg of vitamin
B12, 396.0 mg choline, 0.066 mg of biotin, 0.66 mg of folic acid, 1.32 mg thiamin,
1.32 mg pyridoxine, 82.5 mg of ethoxyquin and 3.6 mg of virginiamycin.
b Supplied per kilogram of diet: 44 mg of manganese, 47.5 mg of zinc,
50 mg of iron, 6.25 mg of copper, 0.3 mg selenium, and 2 mg of iodine.
c Cr-premix consisted of 1 part Cr2O3 to 3
parts starch on a wt:wt basis.
Table 2. The effect of acid, phytase, or acid and phytase on growth and pH
|
Citric Acid, % |
|||
|
Phytase, U/lb |
0.0 |
3.0 |
Mean |
|
|
|||
|
0 |
1.44 |
1.45 |
1.44 |
|
454 |
1.69 |
1.52 |
1.60 |
|
Mean |
1.56 |
1.48 |
|
|
|
|||
|
0 |
4.69 |
4.69 |
4.69 |
|
454 |
4.69 |
4.67 |
4.68 |
|
Mean |
4.69 |
4.68 |
|
|
|
|||
|
0 |
0.341 |
0.311 |
0.326 |
|
454 |
0.356 |
0.327 |
0.342 |
|
Mean |
0.349 |
0.319 |
|
|
|
|||
|
0 |
1.70 |
1.08 |
1.39 |
|
454 |
1.18 |
1.25 |
1.22 |
|
Mean |
1.44 |
1.17 |
|
|
|
|||
|
0 |
1.31 |
0.64 |
0.98 |
|
454 |
0.81 |
0.74 |
0.77 |
|
Mean |
1.06 |
0.69 |
|
|
|
|||
|
0 |
5.03 |
4.08 |
4.55 |
|
454 |
4.08 |
3.07 |
3.58 |
|
Mean |
4.56 |
3.58 |
|
|
|
|||
|
0 |
3.46 |
3.11 |
3.29 |
|
454 |
3.96 |
3.02 |
3.49 |
|
Mean |
3.71 |
3.07 |
|
a Effect of phytase (P < 0.05).
b Effect of acid (P < 0.10).
c Effect of phytase (P < 0.10).
d Effect of acid (P < 0.001).
e Effect of phytase (P < 0.001).
f Acid x phytase interaction (P < 0.001).
Table 3. The effect of acid, phytase, or acid and phytase on apparent ileal digestibility (AID)
|
Citric Acid, % |
|||
|
Phytase, U/lb |
0.0 |
3.0 |
Mean |
|
|
|||
|
0 |
56.82 |
59.94 |
58.38 |
|
454 |
74.21 |
70.83 |
72.52 |
|
Mean |
65.52 |
65.39 |
|
|
|
|||
|
0 |
59.97 |
52.56 |
56.23 |
|
454 |
67.89 |
57.40 |
62.65 |
|
Mean |
63.93 |
54.98 |
|
|
|
|||
|
0 |
72.12 |
77.56 |
74.84 |
|
454 |
74.55 |
74.63 |
74.59 |
|
Mean |
73.34 |
76.10 |
|
a Effect of phytase (P < 0.001).
b Effect of phytase (P < 0.05).
c Effect of acid (P < 0.005).
d Effect of acid (P < 0.05).
e Acid x phytase interaction (P < 0.05).
Table 4. The effect of acid, phytase, or acid and phytase on apparent total tract digestibility (ATTD)
|
Citric Acid, % |
|||
|
Phytase, U/lb |
0.0 |
3.0 |
Mean |
|
|
|||
|
0 |
59.59 |
57.30 |
58.45 |
|
454 |
72.24 |
74.80 |
73.52 |
|
Mean |
65.92 |
66.05 |
|
|
|
|||
|
0 |
51.86 |
47.17 |
49.52 |
|
454 |
62.37 |
58.96 |
60.67 |
|
Mean |
57.12 |
53.07 |
|
|
|
|||
|
0 |
87.41 |
90.20 |
88.81 |
|
454 |
87.91 |
90.29 |
89.10 |
|
Mean |
87.66 |
90.25 |
|
a Effect of phytase (P < 0.001).
b Effect of acid (P < 0.001).
Figure 1. Changes in stomach pH over time. Diet 1: 0.0% citric acid, 0 U/lb phytase; Diet 2: 3.0% citric acid, 0 U/lb phytase; Diet 3: 0.0% citric acid 454 U/lb phytase; Diet 4: 3.0% citric acid, 454 U/lb phytase