Purdue University 1996 Swine Day Report
A.P. Schinckel, L.K. Clark, A.L. Grant, P.V. Malven,
M. McComb, G.G. Stevenson, and J.J. Turek
Departments of Animal Sciences, Veterinary Clinical Sciences, and Veterinary
Physiology and Pharmacology
Management programs for improving the health status of pigs have been developed and are being refined. Examples of these technologies include all-in, all-out production, off-site nurseries and grow-finish units, and medicated early weaning programs. These health management programs produce differences in the duration and intensity of individual and combined diseases as well as the animal's immune system response to antigens. In most cases, immune system responses are a reflection of the disease status. The effects of initial antigen exposure and of the disease must be separated and evaluated to make further refinements in commercial production health management programs. Two trials have been conducted to evaluate the impact of immune system activation via antigenic challenge on pig growth.
One hundred forty terminal cross barrows were weaned and transported to an off-site nursery at 10-14 days of age, i.e., segregated early weaned (SEW). Seventy-six control barrows received no antigenic challenge and were also part of another trial evaluating lean growth. Sixty-four barrows received either a moderate or more intense level of antigenic challenge. Antigens for the challenge included a lipopolysaccharide and vaccines, either modified live or killed, and were given between 12 and 84 days of age, at times corresponding to expected commercial exposure based on antibody titers from 12-84 days of age (Table 1). Pigs were randomly assigned to nursery pens with 8-9 pigs per 4 x 4 ft. pen. The pigs were fed a series of diets designed to maximize lean growth (Table 2). Nursery pigs were weighed and feed consumption recorded at 7 to 10 day intervals. At 52 days of age, the pigs were transported to an open front building. Within each treatment group, four pigs were randomly assigned to each 6 x 12 ft. pen.
In the open front unit, pigs were weighed and feed consumption recorded every 2 weeks. Real-time ultrasonic measurements, including tenth rib backfat depth and loin eye area, were taken every 2 weeks from approximately 70 lbs. body weight until the day before slaughter. The pigs were slaughtered when the pen averaged approximately 260 pounds. Midline carcass backfat, carcass length, and optical probe measurements were recorded.
The mean live weights for the three antigen treatments are shown in Table 3. The antigen treated pigs were significantly lighter than the control pigs beginning at 28 days of age. The magnitude of the weight differences between the three treatments increased up to 107 days of age but decreased thereafter. After 107 days of age, the antigen treated pigs gained weight faster (P < .05) than the control pigs; 2.56, 2.52 and 2.24 lb mean average daily gain for the intense, moderate and control pigs, respectively. However, the antigen challenged pigs required 5.6 more days to reach 230 lbs. and 3.6 more days to reach the mean final weight of 264 pounds.
While in the nursery, antigen challenged pigs had significantly lower rates of growth and feed intake (Table 4). There were no significant differences in feed conversion. The means for the growth rate, feed intake and feed conversion during finishing are shown in Table 5. The unadjusted means and means adjusted for initial weight of the period have different interpretation. From 53-93 days of age, the antigen challenged pigs grew slower and had lower feed intakes (P < .001). However, when the data are adjusted for differences in initial weight of each growth phase, the feed intakes and growth rates are almost identical. Therefore, the majority of the reduced growth and feed intake in the antigen treated pigs is related to their lighter initial weight. Overall, when differences in initial weight are accounted for, there are no significant treatment effects from 54 days to the final weight of 264 pounds.
The mean adjusted backfat thickness and loin eye area measurements are shown in Table 6. Overall, there were no significant differences between the antigen treatments for backfat thickness. However, the antigen treated pigs did have substantially smaller loin eye areas at 72 lbs. liveweight. The differences in loin eye area became less as the pigs grew larger. At 264 lbs. liveweight, the antigen challenged pigs had nearly equivalent loin eye areas to controls.
The carcass measurements are shown in Table 7. There were no significant differences in dressing percentage, optical probe percent lean, or backfat depth. Carcasses of the control pigs tended to have larger loin depths (P < .10) and longer carcasses than antigen treated pigs (P < .04).
Serum concentrations of insulin-like growth factor-1 (IGF-1), a growth factor important in regulating tissue growth, differed (P<.05) among treatements at 63 d of age. Mean concentrations were 61, 103, and 62 ng/ml for control, moderate, and intense treatments, respectively. The apparent elevation in the moderate but not the intense group is difficult to explain.
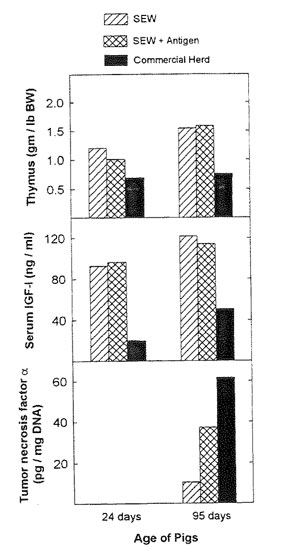
The second trial utilized three treatments: (1) conventional commercial health status pigs managed via continuous flow, (2) SEW, and (3) SEW with the moderate level of antigen exposure to produce immune system activation similar to the commercial herd environment. Large thymus glands have been previously observed in medicated early weaned pigs (Harris et al., 1990). Immune system activation in SEW pigs did not reduce growth rates, cause thymus atrophy, or lower serum IGF-1 levels to the extent observed in a commercial environment with full exposure to disease (Figure 1). The two-fold increase in IGF-1 levels at 95 days of age due to SEW is consistent with Hathaway et al. (1993) who observed 30% higher IGF-1 levels in medicated early weaned pigs at 49 days of age compared to conventionally weaned pigs. Blood levels of tumor necrosis factor (TNF) were elevated in the commercial pigs and antigen exposure of SEW pigs also increased TNF (Figure 1).
The sequence of antigens administered was designed to simulate commercial herd antigen exposure. During the time of antigen challenge, treated pigs in trial 1 had substantially lower feed intakes, lower growth rates, and smaller loin eye areas than control pigs.
When the growth performance of SEW and conventional weaned pigs have been compared, the largest percentage improvement in growth has been from weaning to 7-10 weeks of age. This is likely because young pigs are in an energy dependent growth phase, primarily gaining lean (i.e., protein and water) and thus are sensitive to changes in energy or protein intake (Schinckel, 1994).
Although designed to reflect commercial herd antigen exposure, the antigenic challenges to SEW pigs in the two trials did not reduce performance levels to those observed in commercial production. Barrows raised in the source commercial herd via conventional weaning followed by all-in, all-out management (AIAO), averaged 179 days to 230 lbs. with 1.05 inches of backfat at 245 lb. liveweight. The antigen challenges provided in the first trial only accounted for 13% (5.6/43 days) of the difference between the control and commercial pigs in days to 230 pounds. Therefore, 87% (37.4 days) of the control versus commercial environment differences must be accounted for by the combined effects of increased immune system activation via actual disease, direct disease effects via cell damage and release of other response mediators, management, and overall environmental conditions.
Previous research has also indicated that severity and/or duration of disease cause depressed growth and feed intake. In a Purdue study, AIAO pigs grew faster and more efficiently than the controls (Cline et al., 1992; P<.01). Average daily gain and days to 230 for the AIAO was .19 lb. more and eleven days less, respectively, than the control group. Ninety-four percent of the control pigs had lung lesions indicating the presence of pneumonia with an average of 15.1 percent of the lung infected. However, only 52 percent of the AIAO pigs had evidence of lesions with an average of 4.1 percent of the lung infected.
Another trial, conducted with a mycoplasmal pneumonia vaccine (Respisure, SmithKline Beecham), also indicated that the duration and/or severity of disease affected pig growth (Scheidt et al., 1992). One hundred-fifty pigs were randomly allocated to one of three treatments. Treatment 1 pigs were injected with a Mycoplasma hyopneumoniae vaccine at 7 and 21 days of age, treatment 2 pigs were vaccinated at 6 and 8 weeks of age, and treatment 3 pigs served as non-vaccinated controls. At two months of age, all pigs were moved into pens within a continuous-flow, growing-finishing facility. Twenty-one control pigs, 13 pigs of treatment 1, and 5 pigs of treatment 2 were observed coughing between 2.5 and 5.5 months of age. Pigs in both vaccinated groups gained 7.7% more than the control pigs (P<0.05) during the finishing phase. Days to 230 lb. for pigs in both vaccinated groups was 9 days less than control pigs. Pigs in both vaccinated groups consumed more feed (+7.9%; P<.05) than the control pigs during the finishing phase.
The study of disease, immune system activation, environmental, and stress effects on swine growth is in its infancy. We hypothesize that immune system activation is among several correlated responses of the pig to disease that result in reduced growth performance. Thus, additional research in this area is needed if the swine industry is to realize the genetic potential of high lean growth genotypes to result in the most economical production of lean pork.
Cline, T.R., V.B. Mayrose, A.B. Scheidt, M.A. Diekman, L.K. Clark, C.S. Hurt, and W.L. Singleton. 1992. Effect of all-in/all-out management on the performance and health of growing-finishing pigs. Purdue Swine Day Report. pp. 9-12.
Harris, D.L., S.L. Edgerton and E.R. Wilson. 1990. Large thymus glands in isowean pigs. IPVS Proceedings, Lausanne, Switzerland, p. 291.
Hathaway, M.R., W.R. Dayton, B. Wiseman, T. Molitor and M.E. White. 1993. Effect of weaning pigs at 10 days to off-site clean nurseries on growth rate, IGF-1 levels and serum mitogenic activity. J. Anim. Sci. 71(Suppl. 1, abstr.):43.
Scheidt, A.B., V.B. Mayrose, W.G. VanAlstine, L.K. Clark, T.R. Cline, and M.E. Einstein. 1992. The benefit cost of vaccinating pigs for mycoplasmal pneumonia. Purdue Swine Day Report. pp. 13.
Schinckel, A.P. 1994. Nutrient requirements of modern pig genotypes. Recent Advances in Swine Nutrition. Univ. of Nottingham Press. Loughborough, U.K. Edited by P.C. Garnsworthy and D.J.A. Cole. pp. 133-169.
Table 1. Schedules and types of antigens used for moderate and intense antigenic challenges.
|
Degree of Antigenic Challenge |
|
|---|---|---|
Age |
Moderate |
More Intense |
12 |
V1 |
V1 |
21 |
V2 |
V2 |
28 |
V1' |
V1 |
35 |
|
V2 |
42 |
|
V3 |
49 |
V4 |
V4 |
63 |
|
V3 |
84 |
V4 |
V4 |
Table 2. Formulated values (as-fed basis) of crude protein (CP), lysine and percent added fat of diets fed during each growth phase.a
Diet |
Age, days |
CP |
% Lysine |
Feed Additive |
% Fat Added |
|---|---|---|---|---|---|
Nursery |
12-22 |
22.1 |
1.55 |
Apramycin |
2.0 |
Nursery |
23-44 |
21.8 |
1.50 |
Carbadox |
3.5 |
Nursery-Grower |
45-72 |
20.0 |
1.32 |
Carbadox |
5.0 |
Transition |
73-86 |
19.0 |
1.25 |
Tylosin |
5.0 |
Grower |
86-107 |
18.0 |
1.00 |
Tylosin |
4.0 |
Finisher |
107-market |
17.1 |
.90 |
Tylosin |
4.0 |
aThe first nursery diet contained 6% spray-dried porcine plasma, 24% lactose, and 5% fish meal. The second nursery diet contained 2% spray-dried whole blood meal, 5% fish meal and 16% lactose. The nursery-grower diet contained 1.0% spray-dried whole blood and 1.0% fish meal.
Table 3. Mean liveweights and days to 230 and 264 pounds liveweight.
|
Control |
Moderate |
Intense |
|
|||
|---|---|---|---|---|---|---|---|
Age |
Mean |
SE |
Mean |
SE |
Mean |
SE |
Prob |
12 |
8.8 |
.13 |
8.8 |
.20 |
8.6 |
.20 |
.91 |
19 |
11.5 |
.17 |
11.2 |
.26 |
11.1 |
.26 |
.60 |
23 |
14.3 |
.22 |
13.0 |
.34 |
13.4 |
.34 |
.09 |
28 |
16.8 |
.27 |
15.0 |
.41 |
15.2 |
.41 |
.04 |
33 |
23.1 |
.38 |
20.6 |
.59 |
20.3 |
.59 |
.01 |
44 |
37.4 |
.58 |
34.7 |
.92 |
31.7 |
.92 |
.001 |
54 |
51.5 |
.71 |
45.2 |
1.10 |
43.9 |
1.10 |
.001 |
65 |
64.5 |
1.3 |
56.7 |
2.0 |
51.9 |
2.0 |
.001 |
79 |
94.1 |
1.9 |
82.0 |
2.9 |
78.5 |
2.9 |
.001 |
93 |
128.0 |
1.9 |
112.4 |
3.0 |
108.6 |
3.0 |
.001 |
107 |
162.1 |
2.5 |
142.0 |
3.8 |
138.7 |
3.8 |
.001 |
121 |
197.0 |
2.5 |
180.4 |
3.8 |
176.0 |
3.8 |
.001 |
135 |
227.3 |
2.6 |
209.6 |
4.0 |
204.3 |
4.0 |
.001 |
146 |
253.0 |
2.6 |
239.6 |
4.0 |
239.2 |
4.0 |
.005 |
Days to 230 lbs. |
136.6 |
.9 |
142.0 |
1.4 |
142.4 |
1.4 |
.001 |
Days to 264 lbs. |
151.8 |
.8 |
155.6 |
1.3 |
156.0 |
1.3 |
.02 |
Table 4. Impact of antigenic challenge on rate and efficiency of growth in nursery pigs.
|
Control |
Moderate |
Intense |
|
|||
|---|---|---|---|---|---|---|---|
Item |
Mean |
SE |
Mean |
SE |
Mean |
SE |
Prob |
|
|||||||
ADG, lb/day |
.49 |
.03 |
.38 |
.04 |
.43 |
.04 |
.04 |
Feed Intake, lb/day |
64. |
.02 |
.49 |
.04 |
.54 |
.04 |
.05 |
Feed Conversion |
1.30 |
.08 |
1.28 |
.13 |
1.27 |
.13 |
.98 |
|
|||||||
ADG, lb/day |
1.10 |
.04 |
.98 |
.06 |
.87 |
.06 |
.02 |
Feed Intake, lb/day |
1.54 |
.04 |
1.33 |
.07 |
1.24 |
.07 |
.004 |
Feed Conversion |
1.70 |
.06 |
1.38 |
.10 |
1.42 |
.10 |
.89 |
|
|||||||
ADG, lb/day |
1.39 |
.05 |
1.15 |
.08 |
1.23 |
.08 |
.04 |
Feed Intake, lb/day |
2.32 |
.03 |
1.82 |
.05 |
1.93 |
.05 |
.01 |
Feed Conversion |
1.66 |
.10 |
1.58 |
.15 |
1.57 |
.15 |
.22 |
Table 5. Least squares means for growth rate, feed intake, and feed conversion in finishing pigs.
|
Unadjusted Means |
Means Adjusted for Initial Weight |
||||||||||||
|---|---|---|---|---|---|---|---|---|---|---|---|---|---|---|
|
Control |
Moderate |
Intense |
|
Control |
Moderate |
Intense |
|
||||||
Item |
Mean |
SE |
Mean |
SE |
Mean |
SE |
Prob |
Mean |
SE |
Mean |
SE |
Mean |
SE |
Prob |
|
||||||||||||||
Avg. daily gain, lb/day |
1.96 |
.03 |
1.78 |
.04 |
1.72 |
.04 |
.001 |
1.88 |
.03 |
1.86 |
.04 |
1.82 |
.04 |
.30 |
Feed intake, lb/day |
4.80 |
.07 |
4.18 |
.11 |
4.10 |
.11 |
.001 |
4.50 |
.05 |
4.49 |
.09 |
4.49 |
.09 |
.99 |
Feed conversion |
2.45 |
.04 |
2.36 |
.06 |
2.38 |
.06 |
.18 |
2.40 |
.04 |
2.41 |
.06 |
2.46 |
.06 |
.59 |
|
||||||||||||||
Avg. daily gain, lb/day |
2.35 |
.04 |
2.28 |
.06 |
2.34 |
.06 |
.35 |
2.32 |
.04 |
2.34 |
.06 |
2.40 |
.06 |
.23 |
Feed intake, lb/day |
8.02 |
.06 |
7.73 |
.10 |
7.61 |
.10 |
.002 |
7.88 |
.05 |
7.89 |
.09 |
7.83 |
.09 |
.81 |
Feed conversion |
3.43 |
.04 |
3.43 |
.06 |
3.27 |
.06 |
.08 |
3.42 |
.04 |
3.44 |
.06 |
3.30 |
.06 |
.18 |
|
||||||||||||||
Avg. daily gain, lb/day |
2.18 |
.04 |
2.10 |
.06 |
2.11 |
.06 |
.24 |
2.12 |
.04 |
2.16 |
.06 |
2.19 |
.06 |
.47 |
Feed intake, lb/day |
6.73 |
.04 |
6.44 |
.07 |
6.31 |
.06 |
.002 |
6.57 |
.04 |
6.61 |
.06 |
6.54 |
.06 |
.67 |
Feed conversion |
3.11 |
.04 |
3.09 |
.06 |
3.00 |
.06 |
.39 |
3.16 |
.04 |
3.05 |
.06 |
2.96 |
.06 |
.23 |
Table 6. Least squares means for real-time ultrasonic measurements.a
|
10th Rib Backfat, in |
Loin Eye Area, in2 |
||||||||||||
|---|---|---|---|---|---|---|---|---|---|---|---|---|---|---|
|
Control |
Moderate |
Intense |
|
Control |
Moderate |
Intense |
|
||||||
Weight |
Mean | SE | Mean | SE | Mean | SE | Prob | Mean | SE | Mean | SE | Mean | SE | Prob |
72 |
.32 |
.01 |
.32 |
.02 |
.33 |
.02 |
.90 |
2.22 |
.03 |
1.90 |
.05 |
1.84 |
.05 |
.004 |
88 |
.49 |
.01 |
.42 |
.02 |
.40 |
.02 |
.50 |
2.60 |
.03 |
2.53 |
.05 |
2.43 |
.05 |
.05 |
120 |
.54 |
.01 |
.55 |
.02 |
.54 |
.02 |
.92 |
3.26 |
.04 |
3.25 |
.06 |
3.11 |
.06 |
.21 |
153 |
.69 |
.02 |
.70 |
.03 |
.70 |
.03 |
.98 |
3.77 |
.04 |
3.60 |
.06 |
3.50 |
.07 |
.10 |
189 |
.85 |
.02 |
.86 |
.03 |
.83 |
.03 |
.82 |
4.56 |
.08 |
4.38 |
.10 |
4.28 |
.10 |
.14 |
248 |
1.19 |
.03 |
1.17 |
.04 |
1.15 |
.04 |
.65 |
5.59 |
.07 |
5.40 |
.09 |
5.36 |
.09 |
.17 |
264 |
1.30 |
.04 |
1.24 |
.06 |
1.24 |
.06 |
.45 |
5.76 |
.08 |
5.60 |
.13 |
5.58 |
.12 |
.34 |
a Adjusted for liveweight.
Table 7. Least squares means for the carcass measurements.a
|
Control |
Moderate |
Intense |
|
|||
|---|---|---|---|---|---|---|---|
Variable |
Mean |
SE |
Mean |
SE |
Mean |
SE |
Prob |
Dressing percentage |
74.1 |
.35 |
74.0 |
.44 |
73.7 |
.44 |
.42 |
Fat depth, in |
1.20 |
.04 |
1.25 |
.05 |
1.21 |
.05 |
.61 |
Muscle depth, in |
2.25 |
.073 |
2.17 |
.04 |
2.16 |
.04 |
.09 |
Optical probe, % lean |
49.7 |
.38 |
48.8 |
.46 |
49.2 |
.46 |
.30 |
|
|||||||
Backfat last rib, in. |
1.30 |
.04 |
1.36 |
.06 |
1.31 |
.06 |
.52 |
Backfat 10th rib, in. |
1.35 |
.04 |
1.37 |
.06 |
1.38 |
.06 |
.82 |
Carcass length, in. |
31.8 |
.13 |
31.2 |
.22 |
31.0 |
.22 |
.04 |
a Adjusted for liveweight.
Figure 1. Thymus weights (g/kg live weight), serum IGF-1 less (ng/ml) and tumor necrosis factor a levels (pg/mg DNA) of pigs raised via segregated early weaning (SEW), SEW plus antigen exposure or raised in a commercial herd.
Index of 1996 Purdue Swine Day Articles
If you have trouble accessing this page because of a disability, please email anscweb@purdue.edu.