Purdue University 1999 Swine Day Report
A.P. Schinckel, J.W. Smith, M.D. Tokach, M.E. Einstein, J.L.
Nielsen, and R.D. Goodband
Department of Animal Sciences, Purdue University and Kansas State University
Currently, swine nutritionists formulate diets based upon estimates of protein accretion in controlled university or private research facilities. However, these dietary recommendations may not be correct because of farm-to-farm differences in environmental conditions, including health status, stocking density, quality and social factors.
Methods have been developed to predict farm-specific protein accretion curves and daily lysine requirements. The technique has been used in numerous farms with different genetics. In most cases, 24 to 40 barrows and gilts have been weighed and ultrasonically measured every three weeks from 50 to 250 lb live weight. The precision of the protein accretion curves and lysine requirements can be evaluated by quantifying the sampling errors. Bootstrapping is a resampling procedure used to obtain the standard errors of the growth curves and predicted lysine requirements at each live weight or day of age. Bootstrapping procedures are not currently available on any commercially available statistical analysis packages. Data-specific programs must be written. The computer memory requirements for bootstrapping can be substantial. The objective of this research was to evaluate an empirical method to develop approximate standard errors associated with the growth and predicted lysine requirement curves.
Data were obtained from two commercial farms. Live weight growth, body component growth, and predicted lysine requirement curves were estimated by three different methods. The first method was to serially scan 80 pigs (40 barrows and 40 gilts) on each of the two farms. Pigs were randomly identified within one week of entering the finishers. The same pigs were weighed and scanned every three weeks.
The second method called "mass scanning" was to randomly identify pigs of different age groups on the farm at one specific day. Eighty pigs (40 barrows and 40 gilts) were randomly identified at each 21-day age group. The 21-day age groups ranged from just entering the finishing facility to 250 lb live weight. Three mass scans were completed on each farm.
The third method was to combine the data for the three mass scans. This triples the amount of data (120 gilts or barrows) and reduces the impact of age group-to-group variation, as there are three groups of 40 pigs of the same sex with data at each 21-day target age.
Live weight and real-time ultrasound data were used to determine live weight
growth, protein, and lean accretion curves based on prediction equations
developed at Purdue University. Different equations were used to predict body
composition at different live weight ranges: 45 to 70, 70 to 90, 90 to 120, 120
to 176, 176 to 220, and 220 to 300 lb. Live weight mass (WT) was fit as a
function of age (t) using a generalized non-linear
![]() function, where WTM is an estimate of mature live weight. Empty-body protein
mass (EBP) data were fit as a function of live weight (x) by a generalized
non-linear
function, where WTM is an estimate of mature live weight. Empty-body protein
mass (EBP) data were fit as a function of live weight (x) by a generalized
non-linear ![]() function. Empty-body lipid mass (EBL) was fit to an exponential
function. Empty-body lipid mass (EBL) was fit to an exponential
![]() function
of live weight (x).
function
of live weight (x).
The residual standard deviation (RSD) was calculated by the equation
 ,
where ei is the residual value for the ith observation, n
is the number of observations, and p is the degrees of freedom for the model.
Daily live weight gain and percentage protein and lipid accretion relative to live weight gain were determined as the derivative of each function. Daily protein and lipid accretion rates were determined by δC/δt = [(δC/δLWT) x (δLWT/δt)]. Metabolizable energy (ME) requirement curves were determined by the following equation: ME = (.4 x Empty Body Protein Mass.78, kg) + (10.93 x Protein Accretion, kg/day) + (12.64 x Lipid Accretion, kg/day). Metabolizable energy requirements were divided by the energy content of the diet (3300 kcal/kg or 1500 kcal/lb) to determine the estimated daily feed requirement.
Lysine requirements for each gender of pig on each farm were determined by estimating the maintenance lysine requirement and the lysine requirement for lean growth. Maintenance lysine requirement was estimated by: Maintenance Lysine Requirement = .036 x Body Weight.75 (kg).
Lysine requirement for lean gain was estimated by: Lysine Requirement for Lean Gain = (.066 x daily protein accretion, g/day) ÷ .65, where .066 is the lysine content of muscle, and .65 is the efficiency of lysine utilization. Total lysine requirement was determined by: Total Lysine Requirement = (Maintenance Lysine Requirement + Lysine Requirement for Lean Gain) ÷ .80, where .80 is the digestibility of lysine.
Bootstrapping procedures were used to obtain the standard errors of the growth curves and predicted lysine requirement values. The residual values of each original observation were randomly assigned to different observations and the new simulated dataset was reanalyzed. The procedure was repeated 100 times, such that 100 protein accretion, lipid accretion, predicted energy intake, and predicted daily lysine requirement curves were produced. The standard errors of each predicted value were estimated as the standard deviation of the predicted values at each day of growth. These results of the bootstrapping analysis from the serial (n=4), mass (n=12), and combined (n=4) analyses were combined.
Regression analysis was then used to evaluate the ability to predict standard errors of the curves. The dependent variables used were sex of pig, the type of scan (serial, mass, combined mass), live weight, (live weight)2, (live weight)3, the RSD of the three nonlinear functions (live weight, protein mass and lipid mass), and the two-way interactions between the linear and quadratic live weight variables (live weight and (live weight)2) and the RSD of each of the three nonlinear functions. The independent variables were added using the forward stepwise procedure of SAS.
The standard errors of all variables had a curvilinear relationship with live weight. The standard errors of each variable were greatest at the lightest live weights (50-80 lb) and heaviest live weights (230-250 lb). The analyses that had greater RSDs for one or more of the three component functions (live weight, protein mass, lipid mass) had greater standard errors associated with the protein accretion and nutrient requirement curves. These results agree with previous results for bootstrapping.
For all variables except average daily gain, the standard errors of the predicted values were smallest for the combined mass scans, intermediate for the serial scans and greatest for the mass scans. For growth rate, however, the standard errors for mass and combined serial scans were very similar. This is due to the fact that although the mass scan data had 70-100% greater RSD for the live weight function, the combined mass scan had three times (120 vs. 40) the number of observations at each age.
The regression equations closely predicted the bootstrapping estimates of the
standard errors. Figures 1 through 12 display the mean bootstrapping estimates
and empirically predicted standard errors for the predict average daily gain,
protein accretion, daily lysine requirements, and grams of lysine/Mcal ME for
each method of live weight and scan data collection. It is important to note
that the standard errors in the figures are correct for the number of
observations (pigs) used in this trial. If a different number of pigs are used
at each age, then the standard errors at each age or live weight can be adjusted
by the factor ![]() ,
where N0 is the number of pigs (40 for individual mass and serial
scans or 120 for combined mass scans) and N1 is the number of pigs
used at each age in the specific trial.
,
where N0 is the number of pigs (40 for individual mass and serial
scans or 120 for combined mass scans) and N1 is the number of pigs
used at each age in the specific trial.
Bootstrapping is an accurate, but tedious, method to establish the standard errors of nonlinear growth functions and subsequent nutrient requirements. Approximate values of the bootstrapping results can be more simply developed by utilizing multiple regression equations. This will allow the development of standard errors and confidence bands for farm-specific growth curves and nutrient requirements to be more easily established.
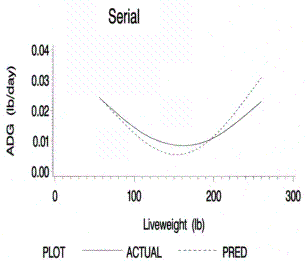
Figure 1.
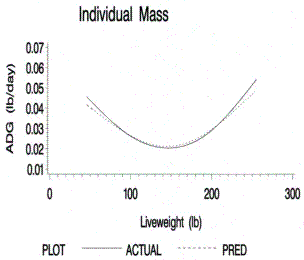
Figure 2.

Figure 3.
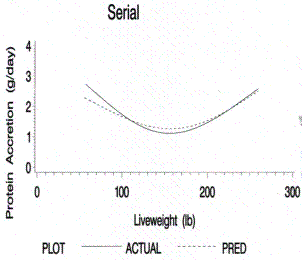
Figure 4.
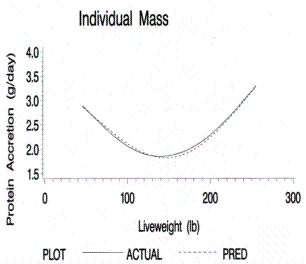
Figure 5.
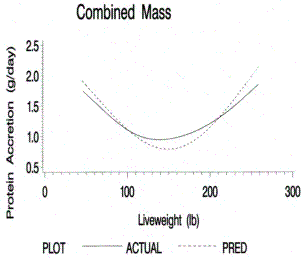
Figure 6.
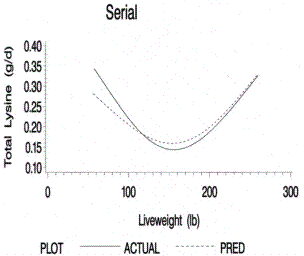
Figure 7.
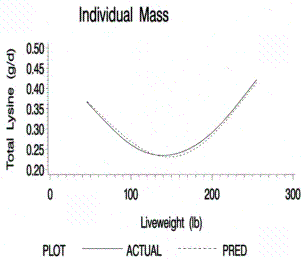
Figure 8.

Figure 9.

Figure 10.
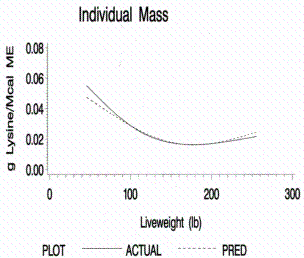
Figure 11.
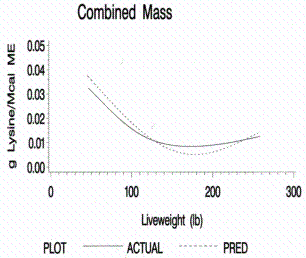
Figure 12.
Index of 1999 Purdue Swine Day Articles
If you have trouble accessing this page because of a disability, please email anscweb@purdue.edu.