N. Li, A.P. Schinckel, P.V. Preckel, and B.T. Richert
Departments of Agricultural Economics and Animal Sciences
Introduction
When to start feeding Paylean to late finishing pigs is an important decision for pig producers. Currently, producers seem to have different management strategies regarding the Paylean onset weight or age. Some producers follow the recommended strategies of feeding Paylean for four weeks before marketing, while others believe it is optimal to start RAC after the first batch of heaviest pigs is marketed. To find out the impact of Paylean onset ages on production returns, a stochastic model was employed to investigate the optimal return and management under alternative Paylean onset ages (model development is presented in Part I).
In addition, swine producers face the problem of estimating the average weight of a group of pigs in order to start feeding Paylean at the right time point. The stochastic growth model implicitly assumed that producers know the exact weight of each animal, and thus make precise decisions based on this complete knowledge. This assumption can be approximately realized only with the recently invented automatic weighing/sorting system, where one or more electronic scales are equipped in a barn and animals are weighed and sorted automatically. However, in the traditional way of pig farming, producers have to rely on their experience to estimate the average weight for a group of pigs. Inevitably, the estimation made based on experience is not accurate, and the difference between the estimated weight and the true weight is referred to as the visual inspection error. It was reported that the standard deviation of visual inspection error ranged from 9 to 11 lb depending on experience (Korthals, 2000; 2001). It follows that if the Paylean onset decision is made based on the average weight of the herd, the existence of visual inspection error will lead to a deviation in Paylean starting time, which would be a few days from the desired time. To estimate the loss of non-optimal Paylean starting age induced by visual inspection error, sensitivity analysis of return with respect to non-optimal Paylean starting age was performed at days around the optimal values. Elasticities of return with respect to optimal Paylean onset age were calculated, where the elasticities portrayed a percentage change in optimal return when Paylean was administered one day off the optimal.
Simulation Setting
The simulation research was conducted for SEW gilts only for demonstration. The model was used to optimize the return and management for alternative Paylean onset ages under payment scheme 3. Payment scheme 3 simulates a carcass merit payment system and possesses an approximate linear relationship between return and lean growth (a detailed description of payment scheme 3 is presented in Part I). The model restricted Paylean to be fed either earlier or later than the optimal onset age, as well as fixed the Paylean concentration at 5.9 g/ton (6.5 ppm), while leaving the dietary lysine concentrations in each diet, time to switch to diet 3, and marketing management to be optimized.
Sensitivity analysis on return with respect to Paylean starting ages was conducted for pigs marketed by payment scheme 3 only. The elasticities of return with respect to Paylean starting time were calculated for 1 to 5 days earlier or later than the optimal Paylean onset age. Because the standard deviation of the visual inspection error was 9 to 11 lb, 1 to 5 days off the optimal day seemed to be likely to happen. In computing the return under each alternative Paylean starting ages, the management variables, such as dietary lysine concentrations, diet switch ages, Paylean concentration, sort weight, etc. were fixed at the optimal values (the optimal values were displayed in Table 4 of Part I). The model allowed the numbers of batches and marketing ages for each batch to be optimized.
Analysis on Alternative Strategies of RAC Onset Timing
The optimal return and management under alternative Paylean onset ages are reported in Table 1, where the first row lists the days earlier or later than the optimal onset age, with positive for shifted later and negative for shifted earlier. The optimal Paylean onset age was day 128, which corresponds to the zero value in the table. The column under day 28 simulates the management strategies of not feeding Paylean to the first batch of heaviest pigs.
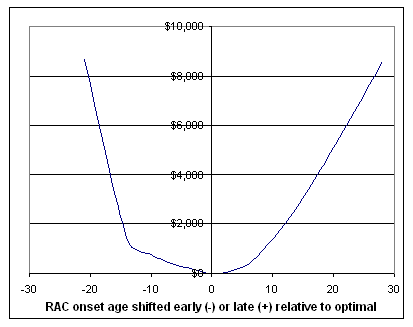
Within expectation, the results indicate that the further away from the optimal Paylean onset age, the less return was obtained. It was found that when the Paylean starting day was shifted further from the optimal, the potential loss would increase at an accelerating rate (Figure 1). The loss of delaying Paylean onset by one week was $623/barn/year, and $2,672 if by two weeks. The curve of annual losses versus the numbers of days off the optimal Paylean starting age (Figure 1) resembles a quadratic function, but was non-symmetric with respect to zero value.
However, the returns relative to the optimal value were not symmetric. For example, the loss of delaying Paylean administration by 3 days was approximately $68/barn/year, while starting Paylean 3 days earlier, the loss would be as high as $161/barn/year. The loss was calculated as the difference of the annual return between the obtained level under restriction and the non-restricted optimal. The simulation results indicated that feeding Paylean at an earlier age relative to the optimal incurred a higher loss than delaying Paylean feeding by the same number of days. The magnitude of the loss suggested that the acceptable window for Paylean onset was around 10 days, three days ahead of optimal and 7 days behind.
For conservative producers, the strategies of Paylean onset time might depend on the ratio of return from Paylean, i.e., the amount of return per dollar spent on Paylean. This ratio was also calculated (Table 1). Returns per dollar of Paylean were well above one in most cases investigated, except when feeding Paylean 3 weeks earlier than the optimal. In that case, although the return per dollar of RAC was below one, there was still a higher return than for the control pigs, and using Paylean was still profitable. The highest ratio of return for Paylean was 3.57, where Paylean was started at day 143 of age and pigs were fed Paylean for an average of 16.1 days.
Generally, pig producers aim at maximizing the return for their facilities. This is consistent with maximizing return from Paylean, but different from maximizing the ratio of return from Paylean. For example, in the case where ratio of return from Paylean was maximized (14 days later than the optimal), the net return from Paylean was actually only 74% of the optimal level, although they consumed 60% the amount of Paylean relative to the optimal. In the case when Paylean was fed 21 days later than the optimal, the amount of Paylean used was 45% of that of the optimal management, but the return from Paylean was 48% of the optimal. Thus, it has a higher ratio of return for Paylean (3.1:1) than that of the optimal (2.87:1). When Paylean onset age was pushed beyond 3 weeks, the ratio of return for Paylean was below the optimal level, thus this was not an acceptable strategy.
The optimal numbers of batches was between one and four. When Paylean was started too early (such as 21 days ahead), it was optimal to market pigs in one day. On contrary, when Paylean feeding was started too late (28 days delaying), it was optimal to market the pigs in 4 batches, resulting in a slightly longer barn turn-over period. In the cases between these times, pigs were marketed in 2 or 3 batches.
As expected, the amount of Paylean intake decreased with Paylean onset age. In general, the numbers of under-weight pigs decreased with Paylean onset age, while the numbers of over-weight pigs seemed to increase with Paylean onset age when Paylean was fed earlier than the optimal age, and followed no pattern when Paylean was fed later than the optimal.
Analysis on Loss of Visual Inspection Error for Paylean Onset
In this section, producers were assumed to take the correct strategy on Paylean onset time, but due to visual inspection errors, the optimal timing of Paylean onset could not be followed exactly. Model predictions on return and elasticities of return with respect to changes in Paylean onset age are reported in Table 2. The returns were not comparable with those reported above because many variables, such as the dietary lysine concentrations in each diet, were fixed rather optimized. Also, the sensitivity analysis focused on the loss associated with visual inspection error, rather than alternative Paylean feeding strategies.
The sensitivity analysis showed that when inspection error led to earlier Paylean onset ages than the optimal, the loss would be approximately increasing by 0.10% if shifted by an additional day. The percentage of losses were relatively low when Paylean was started later than the optimal, with the loss increase at 0.02-0.07% if delayed within 4 days, and the loss increased to 0.11% if delayed by 5 days. The sensitivity analysis result was consistent with the strategies analysis on Paylean onset age.
Applications
The optimal time to start Paylean is an important factor in influencing the return to the swine facility and the use of the Paylean technology. Because the marketing weights of finishing hogs were often closely related to the packer's non-discount payment range, Paylean onset time determined the Paylean feeding duration to a large degree. Results from simulation analysis showed that deviations from the optimal Paylean starting age would incur losses in production return, and the further away from the optimal starting point, the higher the loss would be. The loss of starting Paylean early relative to the optimal point was higher than delaying the Paylean onset age by the same amount of time.
References
Korthals, R.L.. "Weighing and Optimization of Swine Marketing." The American Society of Agricultural Engineers Meeting Presentation. 2000.
Korthals, R.L.. "Monitoring Growth and Statistical Variation of Grow-finishing Swine." Livestock Environment VI: Proceedings of the 6th International Symposium. 2001:64-77.
Table 1. Optimal Paylean and marketing management for SEW gilts when Paylean is started at alternative ages (SEW gilts marketed under payment scheme 3 and fed 5.9 g/ton (6.5 ppm) of Paylean, 1,000 head/barn)
|
RAC onset day shifteda |
-21 |
-14 |
-10 |
-7 |
-3 |
0 |
3 |
7 |
14 |
21 |
24 |
28 |
|
Return, $/barn,day |
291.17 |
311.15 |
312.91 |
313.72 |
314.51 |
314.96 |
314.77 |
313.25 |
307.21 |
299.81 |
296.37 |
291.39 |
|
% of optimal return |
92.4 |
98.8 |
99.3 |
99.6 |
99.9 |
100.0 |
99.9 |
99.5 |
97.5 |
95.2 |
94.1 |
92.5 |
|
Return over control pig ($/head)b |
0.42 |
2.65 |
2.84 |
2.99 |
3.02 |
3.12 |
3.10 |
3.01 |
2.32 |
1.51 |
1.12 |
0.52 |
|
Days on RAC (17% of pigs) |
41d |
33 |
29 |
26 |
26 |
24 |
21 |
17 |
10 |
5 |
4 |
0 |
|
Days on RAC (17% of pigs) |
41d |
39 |
35 |
32 |
30 |
29 |
26 |
22 |
15 |
10 |
9 |
3 |
|
Days on RAC (66% of pigs) |
41d |
41 |
37 |
36 |
30 |
29 |
26 |
25 |
18 |
14 |
13 |
8.5c |
|
RAC intake (gram/group) |
665.66 |
650.20 |
590.31 |
565.88 |
501.28 |
484.72 |
436.86 |
413.64 |
288.49 |
215.82 |
208.70 |
128.71 |
|
Return Ratio of RAC ($/$)e |
0.28 |
1.81 |
2.14 |
2.35 |
2.68 |
2.87 |
3.16 |
3.24 |
3.57 |
3.10 |
2.38 |
1.80 |
|
% under-wt carcass, head |
28.5 |
10.4 |
10.4 |
7.5 |
10.0 |
7.5 |
7.5 |
7.8 |
5.3 |
3.8 |
3.0 |
3.3 |
|
% over-wt carcass, head |
0.3 |
2.2 |
2.5 |
3.0 |
7.5 |
10.8 |
10.3 |
10.2 |
6.4 |
10.3 |
18.2 |
6.3 |
a Negative days denote Paylean onset day shifted earlier relative
to optimal and positive for shifted later.
b Return over control pigs is calculated as the daily return of RAC-treated
pigs minus that for control pigs under the same payment scheme, then the difference
is multiplied by the number of days on feed for RAC pigs from a 50 day old feeder
pig, allowing the barn to be empty 5 days in-between groups.
c Of the 66% of pigs, 17% is fed Paylean for 7 days, and 49% for
9 days, thus the weighed average days on Paylean is 8.5 days.
d The same numbers indicate that all of the 1,000 pigs are marketed
within one day.
e "Return Ratio of RAC" is the ratio of net return of RAC
divided by total cost of RAC, where the number is dollars received for one dollar
spent on RAC.
Table 2. Sensitivity analysis on returns with respect to Paylean starting ages (SEW gilts marketed under payment scheme 3 and fed 5.9 g/ton (6.5 ppm) of Paylean, 1,000 head/barn)a
|
RAC Start Age |
123 |
124 |
125 |
126 |
127 |
128 |
129 |
130 |
131 |
132 |
133 |
|
Return, $/barn,day |
313.5 |
313.7 |
314.0 |
314.2 |
314.6 |
315.0 |
314.9 |
314.8 |
314.7 |
314.1 |
313.3 |
|
Days on RAC (last batch) |
34 |
31 |
30 |
31 |
30 |
29 |
28 |
27 |
26 |
25 |
26 |
|
Average days on RACb |
34.9 |
32.0 |
31.0 |
31.7 |
30.7 |
29.6 |
28.6 |
27.5 |
26.5 |
25.4 |
24.5 |
|
% of optimal return |
0.46 |
0.39 |
0.30 |
0.22 |
0.10 |
0.00 |
0.02 |
0.06 |
0.09 |
0.28 |
0.54 |
|
Elasticities of return with respect to changes in RAC onset age |
0.09 |
0.10 |
0.10 |
0.11 |
0.10 |
0 |
0.02 |
0.03 |
0.03 |
0.07 |
0.11 |
a The return under each Paylean start age is obtained when fixing
the dietary lysine concentration and Paylean concentration at the optimal levels.
b The entry is a weighted average for the group of 1,000 pigs.
Figure 1: Potential loss when RAC starting days are off the optimal ($/year, 1000 hd barn)