Purdue University 1998 Swine Day Report
J.M. Eggert, A.P. Schinckel, S.E. Mills, J.C. Forrest, D.E.
Gerrard, E.J. Farrand, B.C. Bowker, and E.J. Wynveen
Department of Animal Sciences
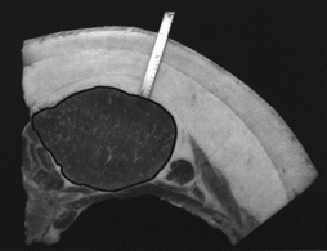
Over the past three years, we have observed that pig genotypes differ not only in the total amount of backfat, but also in the relative amounts of the three individual backfat layers - outer, middle and inner (Figure 1). While it is apparent that these layers differ in chemical, structural and textural properties, their relative contributions to carcass quality remain unknown. Furthermore, we have observed the presence of a well-developed (mature) innermost backfat layer to be associated with higher levels of intramuscular fat within the longissimus dorsi. This suggests that marbling is deposited concurrently with the innermost layer. Thus, the presence of a growing innermost backfat layer may be indicative of a developmental and energy state in which a pig deposits intramuscular fat. Monitoring fat depot development may provide insight into the relationships between individual fat layers and carcass quality. In this trial, we describe the growth of individual backfat layers for three genotypes of pigs and will relate the growth of each layer to pork carcass quality.
Three genotypes that have different rates of fat and lean growth were identified. One hundred twenty barrows and gilts were randomly assigned (4 pigs/pen basis) to a 3 x 2 factorial arrangement with sire line and sex as main effects. The three genotypes consisted of different purebred sire lines - Duroc, Pietrain and Large White - each crossed with the same dam line (Large White x Large White - Landrace). Pigs were reared using segregated early weaning procedures and fed conventional corn-soybean meal diets on an ad-libitum basis. Individual live weights and ultrasonic measurements of backfat and loin eye area were collected every 2 weeks from 50 lb until slaughter. Data on growth traits were collected for the last 100 lb of finishing growth (164 to 264 lb). At 264 lb live weight, eight pigs from each sire line x sex combination were transported to the Purdue Meat Laboratory for slaughter, tissue collection and carcass evaluation. At exsanguination, outer, middle and inner layer backfat and loin were collected and snap frozen in liquid nitrogen until assayed for percent lipid, fatty acid composition and gene expression. At 24 hours postmortem, standard carcass measurements such as backfat depths, loin eye area, and subjective loin eye quality (color, firmness/wetness and marbling) were taken. Standardized loin slices were obtained for evaluation of drip loss. Bellies were removed from the carcasses and subjectively graded for firmness.
Growth and Carcass Traits
From 165 to 264 lb live weight, Duroc-sired pigs demonstrated greater average daily gain and greater feed intake than did Pietrain and Large White-sired pigs (Table 1). Duroc-sired pigs had lower loin weights, received higher marbling scores of the loin muscle at the 10th rib, and had more middle layer, inner layer and total fat depth at the 10th rib than did Pietrain and Large White-sired pigs (Table 2). Pietrain-sired pigs had larger loin eye areas, less outer layer backfat, and lower belly weights than did Duroc or Large White-sired pigs (Table 2). Sire line did not affect feed efficiency, 24-hour postmortem pH (longissimus dorsi), drip loss, loin color or loin firmness evaluations.
Growth Curves
The growth curves for total backfat and outer, middle and inner backfat layers are presented in Figure 2. As expected, these graphs demonstrate differences between the genotype x sex combinations of pigs for the amount of total backfat and individual backfat layers. However, these graphs further demonstrate different patterns of fat growth for different types of pigs. The outer layer appears to grow linearly for most pigs, while the middle layer grows at an increasing rate. Most notable is that inner layer fat growth is approaching a plateau for Pietrain-sired barrows and Large White-sired gilts, while all other pigs are depositing inner layer backfat at an accelerating rate. While the endpoints for the inner layer backfat of Pietrain-sired barrows and gilts are similar, differences in their pattern of inner layer growth would predict different levels of intramuscular fat, according to our hypothesis.
A comparison of individual backfat layer growth for each of the genotype x sex combinations is presented in Figures 3 (barrows) and 4 (gilts). These curves demonstrate differences in the pattern of individual fat layer deposition both within and across genotypes. Differences in the relative contribution of each layer to total backfat depth are also apparent.
Applications
Analyses of the amount (percent intramuscular fat) and types of fat (fatty acid profiles) are in progress. Once completed, the relationships between the growth rate of individual backfat layers and a number of pork quality and carcass composition characteristics will be determined. A more accurate method for predicting intramuscular fat in the live animal can be developed if the relationship between the growth of the inner layer and intramuscular fat is confirmed. In future trials, growth of intramuscular fat will be modeled in an effort to better define the relationship between the growth of inner layer backfat and intramuscular fat. This trial presents data that suggest that the backfat of pigs should be considered as three separate tissues. Should further analyses determine that a certain layer is more closely related to pork carcass quality traits, the potential for differential selection exists.
Adipose tissue from the individual backfat layers of these pigs will be analyzed for the expression of a number of genes. The genes of interest include genes believed to be involved in adiposity and the regulation of feed intake. Based upon the findings presented here, we hypothesize that differences in gene expression will exist both across genotypes (within a layer) and across individual backfat layers (within a genotype). Knowledge of the biological differences between average and lean pigs will allow us to more specifically select for components of fat growth and to identify genes that have major effects on pig growth and development.
Figure 1 - Photograph of outer, middle and inner backfat layers.
Table 1. Effects of sire line on finishing growth (160 to 260 lb).
Trait |
Duroc |
Pietrain |
White |
SE |
Sig.* |
|---|---|---|---|---|---|
Average Daily Gain (lb) |
1.93 |
1.68 |
1.69 |
0.05 |
P<.01 |
Average Daily Feed Intake (lb) |
6.32 |
5.58 |
5.56 |
0.11 |
P<.01 |
Feed Efficiency |
3.28 |
3.36 |
3.29 |
0.07 |
Not sig. |
Adjusted Days to 269 lb (NSIF) |
167.6 |
174.6 |
176.7 |
1.63 |
P<.01 |
*Not sig. = not significant, P>.05.
Table 2. Effects of sire line on growth and carcass composition.
Trait |
Duroc |
Pietrain |
White |
SE |
Sig.* |
|---|---|---|---|---|---|
Slaughter Weight (lb) |
278.4 |
269.1 |
259.4 |
2.67 |
P<.01 |
Dressing Percentage (%) |
81.09 |
78.73 |
77.75 |
0.71 |
P<.05 |
Carcass Length (in.) |
33.19 |
33.20 |
34.06 |
0.17 |
P<.01 |
First Rib Backfat (in.) |
1.72 |
1.45 |
1.52 |
0.06 |
P<.01 |
Last Rib Backfat (in.) |
1.25 |
1.11 |
1.19 |
0.05 |
Not sig. |
Last Lumbar Backfat (in.) |
0.94 |
0.69 |
0.99 |
0.05 |
P<.01 |
10th Rib Fat Depth, total (in.) |
1.12 |
0.78 |
0.96 |
0.05 |
P<.01 |
10th Rib Fat Depth, outer layer (in.) |
0.37 |
0.31 |
0.36 |
0.01 |
P<.01 |
10th Rib Fat Depth, middle layer (in.) |
0.49 |
0.31 |
0.41 |
0.03 |
P<.01 |
10th Rib Fat Depth, inner layer (in.) |
0.27 |
0.16 |
0.17 |
0.02 |
P<.01 |
Loin Eye Area (sq.in.) |
6.84 |
7.59 |
6.78 |
0.21 |
P<.05 |
Loin Color** |
2.78 |
2.72 |
2.69 |
0.08 |
Not sig. |
Loin Firmness** |
2.81 |
2.59 |
2.59 |
0.15 |
Not sig. |
Loin Marbling** |
2.41 |
1.25 |
1.41 |
0.14 |
P<.01 |
Ultimate pH (24-hour) |
5.45 |
5.45 |
5.48 |
0.02 |
Not sig. |
Drip Loss (%) |
2.94 |
3.42 |
3.59 |
0.43 |
Not sig. |
Loin Weight (lb) |
6.03 |
6.88 |
6.58 |
0.14 |
P<.01 |
Tenderloin Weight (lb) |
1.00 |
0.97 |
0.96 |
0.03 |
Not sig. |
Belly Weight (lb) |
16.26 |
15.23 |
15.94 |
0.26 |
P<.05 |
*Not sig. = not significant, P>.05.
**NPPC Scoring System.
Color: 1 = pale, pinkish gray; 5 = dark, purplish red.
Firmness: 1 = very soft and very watery; 5 = very firm and dry.
Marbling: 1 = devoid to practically devoid; 5 = moderately abundant or greater.
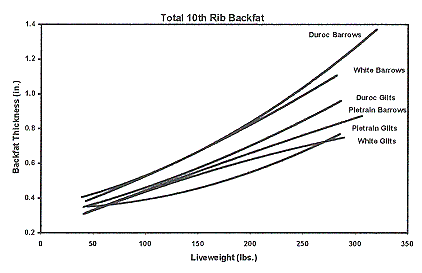
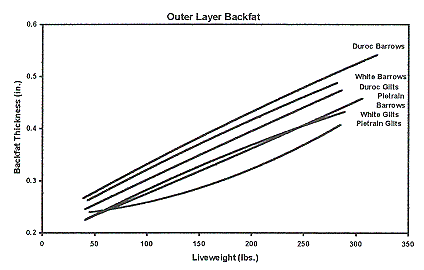
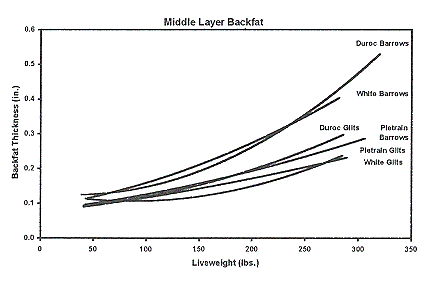
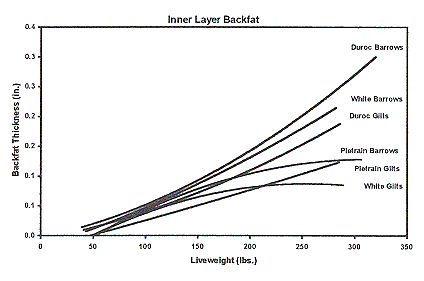
Figure 2. Comparative growth curves for total backfat and outer, middle, and inner backfat layers.
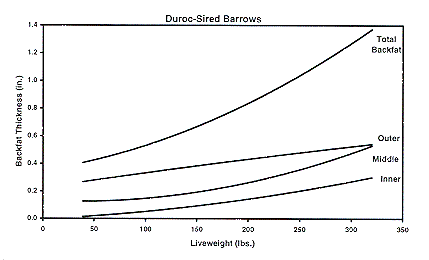
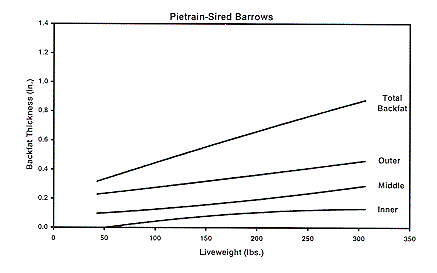
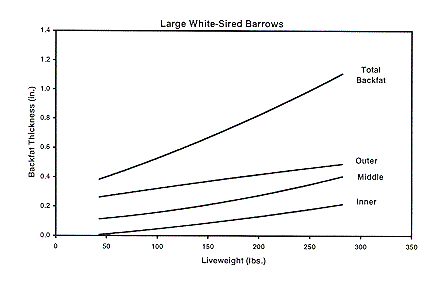
Figure 3. Individual backfat layer growth for barrows.
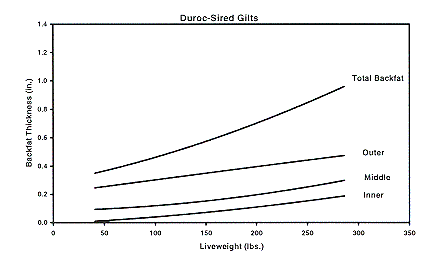
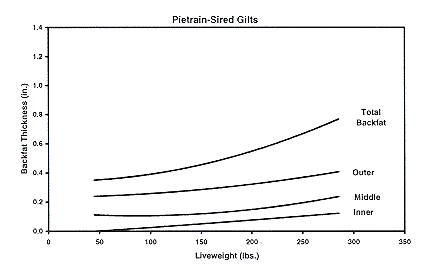
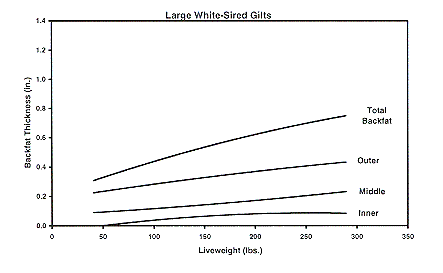
Figure 4. Individual backfat layer growth for gilts.
Index of 1998 Purdue Swine Day Articles
If you have trouble accessing this page because of a disability, please email anscweb@purdue.edu.