Purdue University 1998 Swine Day Report
J.T. Holck, A.P. Schinckel, J.L. Coleman, V.M. Wilt, M.K.
Senn, B.J. Thacker, and A.L. Grant
NOBL Laboratories, Ames, IA; Department of Animal Sciences, Purdue University;
General Veterinary Clinic, Monroe City, MO; Paris Veterinary Clinic, Paris, MO;
Cotswold USA, Alden, IA; Department of Veterinary Diagnostic and Production
Animal Medicine, Iowa State University
Environmental factors including disease exposure, social stress and less than optimal stocking density limit growth. As a result, pigs managed under commercial conditions are unlikely to express their maximum potential protein accretion, even when allowed ad-libitum access to a high quality, nutrient dense diet. The operational protein accretion is the maximum protein accretion rate that pigs can achieve under specified commercial conditions. This definition implies that for a given genotype, the maximum achievable lean growth rate is limited by the environmental conditions under which the pig is raised. Lean growth curves can be used to estimate the magnitude at which environmental conditions (health status, facilities, stressors) limit the expression of the pig's genetic potential for lean growth. A substantial difference between on-farm and maximum achievable protein accretion or lean growth rates is indicative of major environmental limitations. In such cases, the commercial producer must evaluate the benefits and costs of environmental-management changes.
A commercial swine operation in northeast Missouri was used for this study. The operation was a 3-stage, one-site, farrow-to-finish, 130-sow farm stocked with PIC Camborough-15 sows and Line-326 boars. The health status of the herd was considered average for the industry, with a moderate level of respiratory disease in the grower and finisher stages. The sow herd was serologically positive for porcine reproductive and respiratory syndrome virus (PRRS), swine influenza virus (SIV), Actinobacillus pleuropneumoniae (APP) serotype 7, and Mycoplasma hyopneumoniae (MHYO). The herd was selected due to a history of consistently slow-average growth in the grower and finisher stages.
A total of 48 barrows were selected at the completion of the all-in, all-out nursery stage, at 11 weeks of age and an average weight of 65 pounds. The animals were blocked by weight and randomly assigned to either remain in the commercial facility (COMM, n=24) or to be transported to research facilities providing an unrestricted environment (UNRES, n=24). All pigs were individually identified with ear tags, weighed, and measured by real-time ultrasound for backfat and loin eye area at allotment.
The COMM pigs were moved as a group to fill one pen in the on-site grower building. The grower building was a power ventilated, total slat/pull-plug building containing 16 pens. The COMM grower building was managed continuous flow, as two age groups occupied the building at any one time. The trial pen measured 12' x 13', providing approximately 5.5 ft2/hd. The pen contained one 8-hole feeder and 2 nipple waterers. The room temperature in the grower ranged from 64 to 86ºF during the 8 weeks in which the COMM pigs were in the room. The COMM pigs were moved as a group to a pen in the on-site finisher at 19 weeks of age, consistent with the typical pig flow of the commercial operation. The COMM finisher was a naturally ventilated, double curtain sided, partially slatted building that was run all-in, all-out by room. The trial pen measured 8' x 23', providing approximately 7.6 ft2/hd. The pen contained one 32" diameter round feeder and 2 nipple waterers.
The UNRES pigs were transported to a research facility at Iowa State University. The facility contained 8 pens on solid concrete floors with solid steel gating between pens. The room was positively power ventilated and was isolated from other swine during the course of the trial. Each pen measured 8' x 9' and provided approximately 23 ft2/hd with one 2-hole feeder and 1 nipple waterer. The room temperature in the research facility was held constant between 60 and 69ºF for the entire trial period. The UNRES pigs were assigned to one of eight pens by weight in order to equalize mean weights for each pen at the initiation of the trial. UNRES pigs remained in their assigned pens for the entire length of the trial.
All pigs were weighed every 2 weeks following allotment. Backfat depths and loin eye areas were measured by real-time ultrasound every 4 weeks until the group mean weight was approximately 200 pounds. Ultrasound measurements were collected every 2 weeks thereafter until the end of the trial. Fat-free carcass lean and total carcass fat mass were estimated using regression equations that utilized live weight, and real-time ultrasound backfat and loin eye area measurements.
All animals were evaluated until the mean weight of the group was approximately 260 pounds, at which time the entire group was sent to slaughter. Both groups were slaughtered at the Excel packing plant in Ottumwa, Iowa. Individual carcass data (backfat and loin depth using linear ultrasound) were collected at slaughter to estimate percent lean.
Eight pens from each group were randomly selected at allotment for blood sampling at 11, 13, 15, 19, and 23 weeks of age to monitor acute phase protein (alpha-1-acid glycoprotein, AGP) and insulin-like growth factor I (IGF-I) levels.
The data for each environment were statistically analyzed with a series of
nonlinear equations. Live weight gain on test was fit to a three parameter
function:
WTG = MW ( 1 - e - mta )
where WTG is live weight gain on test, MW is mature weight, t is days on test,
and m and a are growth parameters.
Predicted fat-free lean and carcass-fat mass data were fit to augmented
allometric equations:
Y = a Xb ( c - X )d
where Y is component mass, X is live weight, and a, b, c and d are
parameters.
The augmented allometric equations were linearized with a log-to-log
transformation:
log Y = log a + b log X + d log (c-X).
Daily carcass fat-free lean and fat growth rates (lb/day) were predicted as
the product of the derivatives of live weight mass (LWT) on time and component
mass (C) on live weight:
( δC/δt ) = ( δLWT/δt ) x ( δC/δLWT ).
Feed intake data (FI, lb/day) were fit to an exponential function of live
weight:
FI = eb0 + b1LWT + b2LWT2
.
The function was solved by the linear regression:
ln(FI) = b0 + b1LWT + b2LWT2.
Dramatic and significant (P<.0001) differences in bodyweight gain were observed between pigs raised in the two different environments. The mean ADG from 65 to 260 lb live weight was 1.61 and 2.29 lb/day for the COMM and UNRES groups, respectively (Table 1). The UNRES group had significantly higher mean weights by two weeks after allotment compared to the COMM group, and those differences in body weights were magnified during the finishing period. The increased body weights consisted of both fat and lean gain.
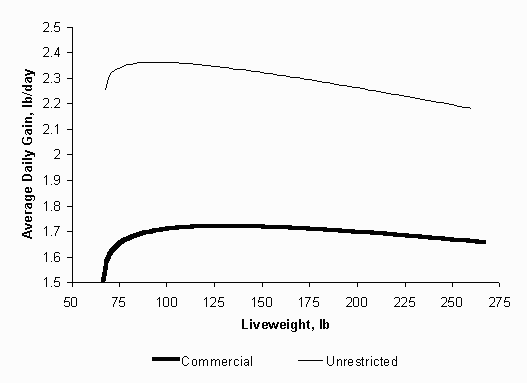
Average daily gain showed a very small increase with live weight, reached a maximum (1.72 lb/day at 130 lb live weight in the commercial and 2.36 lb/day at 93 lb live weight in the unrestricted environment), and decreased slightly as live weight increased (Figure 1). Pigs reared in the unrestricted environment immediately grew faster than pigs reared in the commercial environment. The advantage in live weight growth at each live weight was consistent during the finishing period.
The daily fat-free lean growth rates increased slightly from start of test to a maximum rate achieved at 115 lb live weight in both environments, and then declined (Figure 2). The rate of decline from 115 to 260 lb live weight was greater for pigs reared in the commercial environment (.686 to .357 lb/day commercial environment vs. 862 to .622 lb/day in the unrestricted environment). At 260 lb live weight, the commercial pigs achieved 52% of their maximum daily lean growth versus 72% for pigs reared under the unrestricted environment. The daily fat-free lean growth rates of the unrestricted pigs were substantially greater than the commercial pigs up to 35 days on test. Daily fat growth rates increased as live weight increased for pigs reared in either environment (Figure 3). Daily fat growth was consistently .11 to .13 lb/day higher for the pigs reared under the unrestricted environment.
Feed disappearance increased almost linearly in the UNRES group with a feed intake of 8.23 lb/hd/day recorded during the final 2 weeks prior to slaughter. The increase in feed intake was not linear in the COMM group, which experienced considerable variation, especially in the finishing building (Figure 4).
Biomarkers
Differences in AGP levels (P<.05) were detected between groups following allotment (Table 2). Figure 5 shows changes in AGP levels over time. At the time of allotment (11 weeks), there were no differences in the AGP levels for pigs in the two environments (693.6 for COMM and 691.4 for UNRES). Therefore, the figure shows the overall mean value of 692.5 at this point. While values for both groups tended to decrease over time, the values for pigs reared in the commercial environment were consistently higher than values for those reared in the unrestricted environment. IGF-I values (Figure 6) tended to be different (P=.09) between groups following allotment. The largest differences between groups were seen 2 and 12 weeks following allotment.
The unrestricted environment was designed to provide optimal physical (thermal, stocking density, feed/water access), social (pigs per pen, movement from pen to pen or building to building), and microbial (sanitation, segregation) conditions to minimize physiological and immunological stress. Performance of pigs raised in this environment was used as an estimate of genetic potential for this genetic population of pigs. Differences in lean growth rates between pigs raised in commercial and unrestricted grow-finish environments were clearly demonstrated in this trial. The commercial environment reduced rate of live weight gain, lean and fat accretion to approximately 70% of the potential growth demonstrated in the unrestricted environment. While many researchers have shown performance differences of this magnitude using segregated-early-weaning techniques, it is important to note that in this research trial the pigs were not segregated until 11 weeks of age.
Table 1. Comparison of commercial versus optimal commercial conditions.
|
Environment |
|
|
|
|---|---|---|---|---|
Item |
Commercial |
Optimal |
% Optimal/ Commercial |
Significance |
Daily gain, lb/day |
1.61 |
2.29 |
142 |
P<.001 |
Days to 260 lb |
192 |
160 |
83 |
P<.001 |
Daily fat-free lean gain, lb/day |
.529 |
.753 |
142 |
P<.001 |
Daily fat gain, lb/day |
.529 |
.778 |
148 |
P<.001 |
Daily feed intake, lb/day |
5.41 |
6.60 |
122 |
P<.05 |
Feed/gain |
3.29 |
2.85 |
87 |
P<.05 |
Feed/lean gain |
10.39 |
9.30 |
90 |
ns |
Backfat, in |
.98 |
1.10 |
112 |
ns |
Table 2. Overall mean values of the biomarkers.
Parameter |
units |
COMM |
UNRES |
SEM |
Significance |
|---|---|---|---|---|---|
AGP |
µg/mL |
597.9 |
461.6 |
56.5 |
0.014 |
IGF-I |
ng/mL |
170.0 |
196.8 |
18.5 |
0.09 |

Figure 1. Average daily gain for 65 to 265 lb pigs in the two environments.
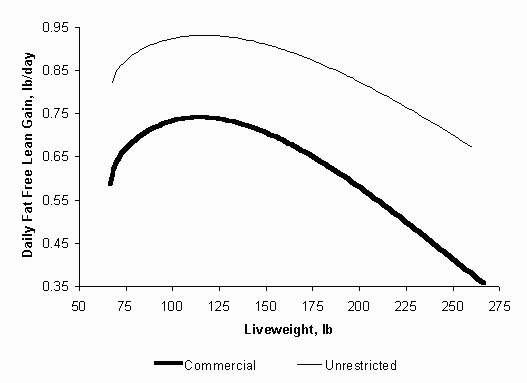
Figure 2. Daily fat-free lean growth rates of pigs reared in two environments.
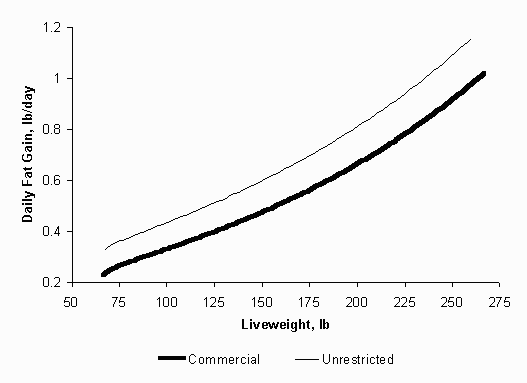
Figure 3. Daily fat gain of pigs reared in two environments.
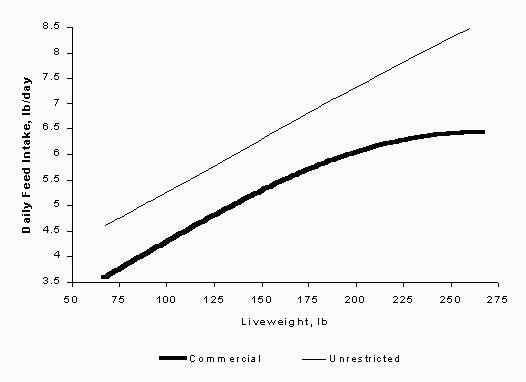
Figure 4. Daily feed intake of pigs reared in two environments.
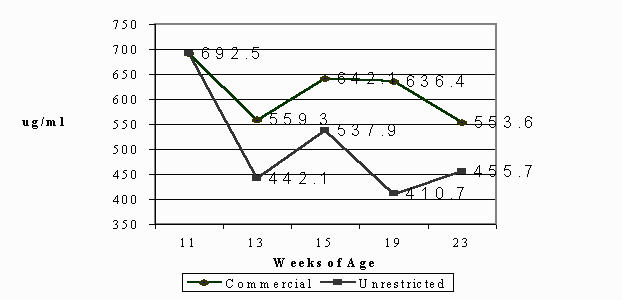
Figure 5. Alpha -1- acid glycoprotein levels.
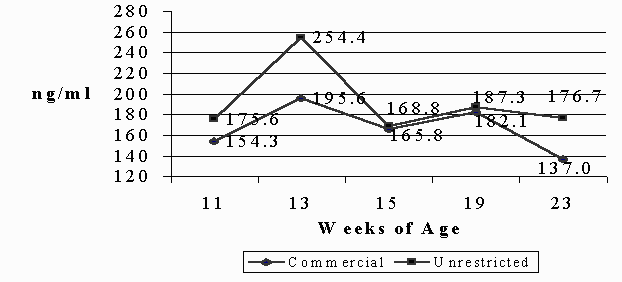
Figure 6. Insulin-like Growth Factor 1 levels.
Index of 1998 Purdue Swine Day Articles
If you have trouble accessing this page because of a disability, please email anscweb@purdue.edu.