Purdue University 1999 Swine Day Report
D.C. Kendall, B.T. Richert, J.W. Frank, S.A. DeCamp, B.A.
Belstra, A.P. Schinckel, and M. Ellis
Department of Animal Sciences, Purdue University and University of Illinois
It has often been shown in research trials that pigs from genetic populations selected for high percent lean (54+% Fat-Free Lean Index; NPPC, 1994) carcasses perform best in ideal conditions. It has also been demonstrated that these same pigs grow substantially slower in less than ideal, commercial situations. With typically lower feed intakes, these animals are more susceptible to environmental stressors. Pigs from average percent lean (50% Fat-Free Lean Index; NPPC, 1994) genetic populations tend to be less sensitive to typical commercial environments. Also, pigs with average percent lean tend to become fatter and relatively less efficient when reared under more ideal conditions.
In order to reduce the loss in performance of pigs in growth-limiting environments, different types of antibiotic and vaccination treatments have been prescribed. Tilmicosin (Pulmotil®) is a medication designed for use in pigs at risk for bacterial pneumonia. Previous research has shown this to be an effective tool to increase performance and decrease death loss.
Little research has been done on the joint effects of genetic potential for lean growth and health management system and effects of antibiotic/vaccination treatment on the performance of pigs. There is also little information about the effects of these criteria on pork quality. The effects of these treatments and differences in performance and quality of the pigs are crucial to a better understanding of the underlying biology of the pig in response to environmental and disease challenges.
Evaluate the magnitude of the difference between two genotypes when tested in two health-management environments. Determine the magnitude of genotype by environmental interactions for lean growth rate, lean feed efficiency, carcass composition, and pork quality.
Evaluate the effect of strategic vaccination-therapeutic antibiotic use to increase lean growth in two health-management environments.
Evaluate the biological causes for the changes in lean growth caused by genetic, therapeutic antibiotic, and health-management environmental changes.
U.S. Yorkshire-Landrace sows were bred to U.S. Duroc sires chosen for high live weight gain/day EPDs (YL/Dur). European Landrace x Duroc-Large White sows were mated to European Duroc-Hampshire sires (EUR). At farrowing, each litter had 4 pigs cross-fostered with another litter of the same genotype. One sow and litter were conventionally weaned and the other early weaned. This allowed equal representation of littermates in both health status environments.
For the early weaned group (SEW), 10-14 day old pigs were weaned, moved to an isolated early-wean facility, and reared until 56 days of age. The eight-week-old pigs were then placed in a curtain-sided building that had been previously emptied, cleaned, and disinfected. For the conventionally weaned group (CON), 28-day-old littermate pigs were weaned and placed in an all-in, all-out nursery. They remained in the nursery until they were 56 days of age. At that time, they were placed in a continuous flow finisher. All pigs were housed at 7 pigs per pen in the nursery and 6 pigs per pen in the grow-finish (Table 1). The pigs were weighed and feed consumption was recorded every two weeks in the nursery and every three weeks in the grow-finish until near the market weight of 250 lb, when pigs were weighed weekly.
In the nursery, all pigs received 50 g/ton Carbadox followed by one week of 400 g/ton Chlorotetracycline (Table 2). Following the Chlorotetracycline, the two antibiotic treatment regimes began. The treatments were: 1) No vaccination with non-medicated diets for the remainder of the trial (Cont), or 2) Mycoplasma hyopneumoniae vaccination (Respisure®) on days 28 and 42 followed by one veterinary feed directive of 272 g/ton Tilmicosin (Pulmotil®) from days 51-72 with 40 g/ton Tylosin for the remainder of the trial (Vac).
Real-time ultrasound measurements were taken on the same 2 pigs per pen at 60, 100, and 135 days of age and on all pigs as they reached market weight. Using this data, protein and lipid accretion curves were generated.
At market, 10th rib backfat (TRBF), last rib backfat (LRBF), loin muscle area (LEA), and carcass weight were obtained at a pork processing plant (IBP, Logansport, Indiana). Visual color, firmness, and marbling scores at the cut surface of the 10-11th rib interface were evaluated at 32° F. Quality scores were reported on a 1 to 5 scale as according to Procedures to Evaluate Market Hogs (NPPC, 1991). In addition, whole loins were recovered from the plant for pork quality testing. Hunter Colorimeter analysis of L*, a*, and b* scores were calculated. Percent drip loss was obtained by using Danish drip loss tubes. The total drip loss/water holding capacity was approximated by centrifugation of the drip loss samples (5 min at 1000 rpm). This is an estimate of maximum drip loss that might be encountered in an excessively handled cut of pork. Loin samples were taken to the University of Illinois for sensory evaluation, intra-muscular fat, moisture, cooking loss and Warner-Bratzler shear force.
Growth and carcass data were analyzed as a factorial arrangement of health status environment, genotype, sex, and antibiotic/vaccination treatments.
The results of the growth performance criteria of average daily gain (ADG), average daily feed intake (ADFI), and gain:feed (G:F) are in Table 3 (CON) and Table 4 (SEW). For days 30 to 51, the SEW pigs had higher ADG (P<.001) and ADFI (P<.001), but lower G:F (P<.10). The YL/Dur pigs had higher ADG (P<.01) and ADFI (P<.01) than the EUR pigs. There were genetic by environment interactions for days 30 to 51 for both ADG (P<.01) and ADFI (P<.05), with the two genotypes performing nearly identically in the SEW environment and then a decrease in both consumption and growth of the EUR pigs in the less optimum CON environment. The last week of the nursery performance and the first two weeks of the finisher performance were analyzed together into days 51 to 72, as this was the period in which the Pulmotil antibiotic was included in the Vac feed.
Growth performance data in the grow-finish phase was adjusted for day 51 weight to ensure that any differences in this phase were not due to the variation in the nursery. During the first stage, days 51 to 72, the SEW pigs had higher ADG (P<.05) and ADFI (P<.001). There were a 10% increase in ADG and an 8% increase in ADFI for the pigs on the vaccination/ antibiotic treatment (P<.001). The YL/Dur pigs also had a higher ADFI during the period (P<.01). For the next period, days 72 to 114, the SEW environment had a 8% higher ADG and higher ADFI (P<.001); however, the CON environment had higher G:F (.42 vs .40; P<.05). The YL/Dur pigs had higher ADFI (P<.001), but the EUR pigs had higher G:F (P<.001). The Vac treatment pigs exhibited both higher ADG and ADFI (P<.001). A genetic by environment interaction for both ADG (P<.001) and ADFI (P<.05) occurred, with the EUR pigs performing substantially better in the SEW (1.97 ADG, 4.71 ADFI) environment in relation to the CON (1.73 ADG, 4.03 ADFI) environment, while the YL/Dur pigs had similar performance in the SEW environment (1.91 ADG, 4.85 ADFI) and CON environment (1.89 ADG, 4.64 ADFI). Also, barrows had higher ADG and ADFI (P<.001) than gilts. An environment by treatment interaction for ADG (P<.01) and ADFI (P<.05) existed, as the two treatments showed very little difference in the SEW environment (1.96 vs. 1.92 lb/day ADG), while the Vac pigs had better performance in the CON environment (1.91 vs. 1.70 lb/day ADG).
For the entire finishing period, days 51 to market, there were genetic differences in ADG (P<.01) and ADFI (P<.001); the YL/Dur had 3.5% higher ADG and 6% higher ADFI, but the EUR pigs had higher G:F (.37 vs. .36; P<.01). The pigs in the SEW environment had greater ADG and ADFI (P<.001) than the CON-raised animals. Furthermore, genetic by environment interactions in ADG (P<.05) showed that the EUR pigs grew proportionally better in the SEW environment (1.87 lb/day) than in the CON environment (1.70 lb/day). However, the YL/Dur pigs had similar ADG in the SEW environment (1.87 lb/day) and the CON environment (1.81 lb/day). There were also significant treatment effects observed for ADG and ADFI (P<.001). Environment by treatment interactions existed for ADG (P<.01) and ADFI (P<.10), caused by the fact that the Vac pigs had markedly better performance in the CON environment (.15 lb/day increase in ADG) and small difference in the SEW environment (.04 lb/day ADG). As would be expected, the gilts grew slower (P<.001) and had lower ADFI (P<.001) than barrows.
Days to market showed major differences between the performance of the animals in the two environments (P<.001). The YL/Dur genotype had better overall days to market by 4 days (P<.05). A genetic by environment interaction also existed (P<.01). The EUR pigs took one day less to 250 lb than the YL/Dur pigs in the SEW environment, but were 10 days slower in the CON environment. There were also decreases in days to market by 5.5 days in Vac pigs versus Cont pigs (P<.01). Barrows required 8 days less to reach market weight than gilts (P<.001). Furthermore, there was a slight reduction in morbidity (5.5% vs. 0.0%) for Vac animals (P<.05).
The carcass characteristics for each environment are shown in Tables 5 and 6. The EUR pigs had lower TRBF measurements (.77 vs. .85 in.), LRBF (.94 vs. 1.01 in.) and last lumbar backfat than the YL/Dur pigs (P<.001). The pigs in the CON environment had less TRBF (P<.05). As expected, gilts had less backfat then barrows (P<.001). No differences in LEA were detected between genotypes, but the two environments did differ (P<.05), with pigs reared in the SEW environment having 7.4 in2 versus 7.2 in2 in the CON environment. The gilts had larger LEA than barrows (P<.001). Percent lean was calculated using the NPPC Procedures to Evaluate Market Hogs 1991 (5% Fat), and showed the gilts were 2.2% leaner than the barrows (P<.001). There was an increase in leanness of 1% for the EUR pigs (P<.01) over the YL/Dur pigs. The EUR pigs also had longer carcasses (P<.001).
Using the subjective procedure for quality scores from NPPC, there were trends for the EUR pigs to have higher color scores (P<.10) and for the pigs in the SEW environment to have higher color scores (P<.10). Marbling scores were significantly higher for barrows (1.78 vs. 1.50; P<.001), and there was a trend (P<.10) for higher marbling scores for the YL/Dur pigs. There was a trend for the barrows to have higher firmness scores (P<.10).
The YL/Dur pigs had higher 24-hour postmortem pH readings (P<.01) than the EUR pigs. The pigs raised in the CON environment also had higher pH readings (P<.01). As might be expected from the lower pH, the EUR pigs had higher 24-hour drip loss (3.6% vs. 1.9%) and total water loss percent (P<.001). There were no observed differences in the Hunter L* color measurement. There were environment differences in a* (P<.05) and b* (P<.01), with the pigs reared in the CON environment being lower in both of these measurements.
The eating quality characteristics showed the YL/Dur pigs had a 0.32% increase in intramuscular fat content (2.08 vs. 1.76) over the EUR pigs (P<.01). However, the taste panel evaluation showed an increase in tenderness (P<.05) and juciness (P<.001) scores for the EUR genotype. The EUR pigs required less shear force (5.25 vs. 5.66; P<.01), but did have higher percent cooking loss (32% vs. 29%; P<.001). Tenderness and juciness scores had a genetic by environment interaction (P<.01), with the EUR pigs improving eating quality in the SEW environment and the YL/Dur pigs decreasing eating quality.
The grade premium placed on each of the carcasses by the slaughter plant shows several differences. The EUR pigs had $0.80/cwt advantage over the YL/Dur animals (P<.05). The pigs in the CON environment also had $0.75/cwt higher grade premiums (P<.05), and there was a $0.75/cwt grade premium advantage for the gilts over the barrows (P<.05).
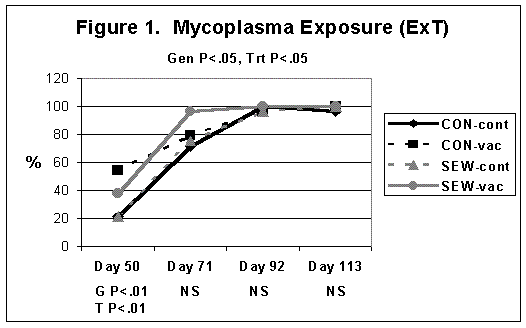
The disease exposure of the pigs as measured by blood levels of antibodies showed that the treated pigs had a higher percentage of pigs that seroconverted (had been exposed) to Mycoplasma at day 50. This is reasonable, because these pigs received a Mycoplasma vaccination, showing that there was response to the vaccine. Then by day 92, all pigs had been exposed to Mycoplasma (Figure 1). There was no exposure to PRRS in the SEW environment up to day 113; however in the CON environment, all pigs were exposed between day 71 and day 92 (Figure 2).
Figure 3 portrays the levels of Insulin-like Growth Factor-1 (IGF-1) listed by environment and treatment. IGF-1 levels in the nursery were not different between groups. As the pigs moved into the finishing phase, however, differences between the groups appeared. The pigs in the SEW environment had IGF-1 levels that were similar, but in the CON environment, the Vac pigs had lower IGF-1 levels at day 113. This figure corresponds with ADG, as IGF-1 is a measure of growth/growth potential in pigs. Figure 4 is illustrating Alpha 1-Acid Glycoprotein (AGP), an acute phase protein that is a broad indicator of stress on the animal. There are environmental and treatment effects for the period measured, with the pigs in the CON environment and control pigs both consistently having higher AGP levels, indicating higher levels of stress. Figure 5 shows levels of Haptoglobin (HAP) by each environment. After day 71, the pigs in the CON environment increased their HAP levels dramatically. Since HAP is another acute phase protein, it can be inferred that these animals were experiencing more stress.
Figure 6 is the ADG curves for each genotype in the two environments. As the ADG data showed previously, the pigs in the SEW environment had consistently higher gains. The EUR genotype in the CON environment had the lowest ADG for the finishing period. In Figure 7, the empty body lean accretion of these same pigs is shown. The pigs in the SEW environment had a 7% higher peak lean accretion and reached it 22 days sooner than the pigs in the CON environment. As a result, the pigs in the SEW environment also had a lower lean accretion late in the finisher. Figure 8 represents the empty body fat accretion of the pigs. The fat accretion among the two genotypes in the SEW environment was similar until 180 lb, then the EUR pigs began to plateau, while maintaining greater lean accretion during this time. In the CON environment, the YL/Dur pigs had higher fat accretion from start to end than the EUR pigs. Figure 9 depicts the estimated lysine requirement in g/day. This is assuming no feed wastage and allowance for variation in feed ingredients. The pigs in the SEW environment have a higher lysine requirement early in the finisher. As the pigs reached 200 lb, the pigs in the CON environment have daily lysine requirements that are similar and then surpass the lysine needs of the SEW pigs. There is also a striking example of differences in lysine requirements between the same genotype in two environments. The EUR pigs in the SEW environment have up to a 1.7 g/day higher lysine requirements at similar body weights compared to their littermates in the CON environment.
This trial has demonstrated the differences in performance between two genetic populations of pigs and how it varies with different management systems. It has been suggested in previous research that pigs from populations selected for high percent lean will respond more negatively to environmental stressors. Pigs from average percent lean genetic populations have been shown to respond to these same stressors, but to a lesser degree. This appears to be the case in this trial. In the SEW environment, differences between the genotypes and treatments were small, but in the CON environment, increased disease pressure increased the differences observed between the treatments and genotypes. Vaccination/antibiotics were used effectively to improve performance of pigs in the CON environment. The carcass data showed smaller differences in leanness and carcass quality than what was expected based on previous data for the genetic populations used in the trial. This would indicate that as producers move towards higher lean animals, a subsequent reduction in carcass quality might occur. There were also indications that environment has an effect on carcass characteristics. The pigs in the SEW environment tended to be slightly fatter with larger LEA, making the percent lean roughly equivalent. Differences in quality traits between the two environments underscore the importance of understanding how pigs from a specific genetic population perform in different environments, health status, and management systems.
Even though the final percent leans were not much different, there are differences in environmetal sensitivity. The shapes of the live weight growth and compostion growth curves were different for the two environments. High health SEW pigs, whether three-site or wean-to-finish, have previously been found to have higher peak lean growth rates at lighter weights and earlier ages than pigs reared under conventional health environments. Nutritional programs need to be tailored differently for the same genotype reared in different environments.
In order for producers to remain competitive, there must be an understanding of the factors affecting the performance of their pigs. This trial has shown that different health status, management, vaccination/antibiotic regimes and their interactions do contribute to pig performance, carcass characteristics, pork quality, and the nutritional program required for optimal growth. Therefore, producers need to take all these factors into account when making management and genetic decisions on their farms.
NPPC. 1991. Procedures to Evaluate Market Hogs. Third Ed. National Pork Producers Council. Des Moines, IA.
NPPC. 1994. Users Guide Fat-Free Lean Index. National Pork Producers Council. Des Moines, IA.
Table 1. Experimental designa.
| Environment: | SEW |
CON |
||||||||||||||
|---|---|---|---|---|---|---|---|---|---|---|---|---|---|---|---|---|
| Genotype: | EUR |
YL/Dur |
EUR |
YL/Dur |
||||||||||||
| Treatment: | Vac |
Cont |
Vac |
Cont |
Vac |
Cont |
Vac |
Cont |
||||||||
| Sex: | B |
G |
B |
G |
B |
G |
B |
G |
B |
G |
B |
G |
B |
G |
B |
G |
Number of pens: |
3 |
3 |
3 |
3 |
3 |
3 |
3 |
3 |
3 |
3 |
3 |
3 |
3 |
3 |
3 |
3 |
a
Environments: SEW = segregated early weaning three site production, CON = conventional weaning with continuous flow grow-finish.
Table 2. Diet sequencea.
Phase |
CON |
SEW |
Lysine, % |
Ca, % |
P, % |
Antibiotic |
|---|---|---|---|---|---|---|
SEW |
0 d |
7 d |
1.7 |
.9 |
.8 |
Carbadox |
Transition |
0 d |
7 d |
1.45 |
.9 |
.8 |
Carbadox |
Nursery P2 |
14 d |
14 d |
1.35 |
.9 |
.8 |
Carbadox |
Nursery P3 |
7 d |
7 d |
1.3 |
.85 |
.75 |
Chlorotetracycline |
Grower 1c |
20 d |
20 d |
1.2 |
.75 |
.65 |
Tilmicosinc |
Grower 2bc |
21 d |
21 d |
1.1, 1.2 |
.75 |
.65 |
Tylosinc |
Finisher 1bc |
42 d |
42 d |
.9, 1.0 |
.75 |
.65 |
Tylosinc |
Finisher 2bc |
to market |
to market |
.75, .85 |
.65 |
.55 |
Tylosinc |
a All diets were standard corn-soy based.
b For lysine, the first number represents the barrow diet and the
second represents the gilt diet.
c Treatments were Cont = no vaccination and non-medicated diets, and
Vac = Mycoplasma hyopneumoniae vaccination, Tilmicosin and Tylan.
Table 3. Continuous flow environment growth performance.
Environment |
CON |
|
|
|||||||
|---|---|---|---|---|---|---|---|---|---|---|
Genotype |
EUR |
YL/Dur |
|
|
||||||
Sex |
Barrows |
Gilts |
Barrows |
Gilts |
|
|
||||
Treatment |
Vac. |
Cont. |
Vac. |
Cont. |
Vac. |
Cont. |
Vac. |
Cont. |
C.V. |
Significancec |
ADG, lb/day |
||||||||||
|
Day 30-51a |
.66 |
.72 |
.72 |
.82 |
.93 |
.88 |
.86 |
.93 |
10.6 |
G** E*** GxE** TxS' |
|
Day 51-72b |
1.45 |
1.28 |
1.39 |
1.38 |
1.47 |
1.39 |
1.52 |
1.37 |
7.5 |
E* T*** |
|
Day 72-114b |
1.94 |
1.56 |
1.80 |
1.62 |
2.06 |
1.88 |
1.86 |
1.74 |
4.9 |
E*** GxE*** T*** ExT** S*** GxS* ExS' TxS' |
|
Day 51-mktb |
1.87 |
1.61 |
1.72 |
1.58 |
1.91 |
1.83 |
1.82 |
1.67 |
3.9 |
G** E*** GxE* T*** ExT** S*** |
ADFI, lb |
||||||||||
|
Day 30-51a |
.91 |
.97 |
.95 |
1.13 |
1.22 |
1.16 |
1.09 |
1.18 |
7.7 |
G** E*** GxE* T' |
|
Day 51-72b |
2.72 |
2.42 |
2.67 |
2.61 |
2.83 |
2.64 |
2.83 |
2.63 |
5.5 |
G** T*** GxExTxS* |
|
Day 72-114b |
4.49 |
3.69 |
4.31 |
3.62 |
5.16 |
4.54 |
4.63 |
4.24 |
7.0 |
G*** E*** GxE* T*** ExT* S*** GxS* |
|
Day 51-mktb |
5.01 |
4.34 |
4.76 |
4.29 |
5.41 |
5.14 |
4.96 |
4.64 |
5.2 |
G*** E*** GxE' T*** ExT' S*** GxS' |
G:F |
||||||||||
|
Day 30-51a |
.73 |
.74 |
.76 |
.73 |
.76 |
.76 |
.80 |
.79 |
6.3 |
G' E* |
|
Day 51-72b |
.53 |
.53 |
.52 |
.53 |
.52 |
.52 |
.54 |
.53 |
5.6 |
|
|
Day 72-114b |
.44 |
.53 |
.42 |
.46 |
.41 |
.42 |
.41 |
.41 |
4.4 |
G*** E* T' GxTxS* |
|
Day 51-mktb |
.37 |
.37 |
.36 |
.37 |
.35 |
.36 |
.37 |
.36 |
3.2 |
G** GxS' |
Nursery wt d51 |
33.6 |
34.9 |
35.5 |
37.3 |
38.4 |
36.5 |
36.2 |
38.4 |
17.1 |
E** |
|
Off-test weightd |
250.1 |
240.6 |
245.9 |
235.3 |
251.3 |
249.6 |
246.0 |
243.7 |
2.14 |
E* GxE' T** S* |
|
Days to Markete |
171.7 |
185.6 |
180.3 |
187.4 |
163.2 |
171.2 |
174.0 |
178.6 |
3.9 |
G* E*** GxE** T** S*** |
|
Death Loss, % |
0 |
5.5 |
0 |
0 |
5.5 |
0 |
0 |
5.5 |
346 |
|
|
Morbidity, % |
0 |
11.1 |
0 |
16.6 |
0 |
0 |
0 |
11.1 |
299 |
T* E' ExT' |
a Values adjusted for initial (day 30) weight.
b Values adjusted for nursery (day 51) weight.
c Significance P-values: ' P<.10, * P<.05, ** P<.01, ***
P<.001; E=Environment, G=Genotype, S=Sex, T=Treatment, x=interation.
d Average weight of all pigs at end of trial.
e Days to market adjusted to 250 lb.
Table 4. Segregated early weaned environment growth performance.
Environment |
SEW |
|
|
|||||||
|---|---|---|---|---|---|---|---|---|---|---|
Genotype |
EUR |
YL/Dur |
|
|
||||||
Sex |
Barrows |
Gilts |
Barrows |
Gilts |
|
|
||||
Treatment |
Vac. |
Cont. |
Vac. |
Cont. |
Vac. |
Cont. |
Vac. |
Cont. |
C.V. |
Significancec |
ADG, lb/day |
||||||||||
|
Day 30-51a |
1.13 |
1.03 |
1.09 |
1.12 |
1.12 |
1.08 |
1.05 |
1.08 |
10.6 |
G** E*** GxE** TxS' |
|
Day 51-72b |
1.52 |
1.44 |
1.55 |
1.39 |
1.67 |
1.39 |
1.52 |
1.39 |
7.5 |
E* T*** |
|
Day 72-114b |
2.04 |
2.03 |
1.92 |
1.89 |
2.12 |
1.97 |
1.78 |
1.76 |
4.9 |
E*** GxE*** T*** ExT** S*** GxS* ExS' TxS' |
|
Day 51-mktb |
1.95 |
1.93 |
1.81 |
1.79 |
2.02 |
1.89 |
1.79 |
1.79 |
3.9 |
G** E*** GxE* T*** ExT** S*** |
ADFI, lb |
||||||||||
|
Day 30-51a |
1.48 |
1.48 |
1.47 |
1.51 |
1.49 |
1.51 |
1.48 |
1.55 |
7.7 |
G** E*** GxE* T' |
|
Day 51-72b |
2.64 |
2.50 |
2.77 |
2.51 |
3.01 |
2.58 |
2.75 |
2.73 |
5.5 |
G** T*** GxExTxS* |
|
Day 72-114b |
4.84 |
4.83 |
4.71 |
4.45 |
5.66 |
4.89 |
4.41 |
4.45 |
7.0 |
G*** E*** GxE* T*** ExT* S*** GxS* |
|
Day 51-mktb |
5.24 |
5.21 |
4.94 |
4.78 |
5.78 |
5.27 |
4.89 |
4.94 |
5.2 |
G*** E*** GxE' T*** ExT' S*** GxS' |
G:F |
||||||||||
|
Day 30-51a |
.70 |
.69 |
.74 |
.74 |
.75 |
.72 |
.71 |
.75 |
6.3 |
G' E* |
|
Day 51-72b |
.54 |
.53 |
.56 |
.52 |
.54 |
.53 |
.55 |
.49 |
5.6 |
|
|
Day 72-114b |
.43 |
.42 |
.41 |
.43 |
.38 |
.41 |
.40 |
.40 |
4.4 |
G*** E* T' GxTxS* |
|
Day 51-mktb |
.37 |
.37 |
.37 |
.38 |
.35 |
.36 |
.37 |
.36 |
3.2 |
G** GxS' |
|
Nursery wt d51 |
43.5 |
41.7 |
42.5 |
43.2 |
42.9 |
41.3 |
41.8 |
41.6 |
17.1 |
E** |
|
Off-test weightd |
250.5 |
249.2 |
251.2 |
246.9 |
251.6 |
248.9 |
246.3 |
244.9 |
2.14 |
E* GxE' T** S* |
|
Days to Markete |
159.1 |
160.3 |
167.5 |
167.7 |
155.1 |
163.5 |
170.5 |
170.2 |
3.9 |
G* E*** GxE** T** S*** |
|
Death Loss, % |
0 |
5.5 |
0 |
0 |
0 |
0 |
0 |
0 |
346 |
|
|
Morbidity, % |
0 |
0 |
0 |
0 |
0 |
0 |
0 |
5.5 |
299 |
T* E' ExT' |
a Values adjusted for initial (day 30) weight.
b Values adjusted for nursery (day 51) weight.
c Significance P-values: ' P<.10, * P<.05, ** P<.01, ***
P<.001; E=Environment, G=Genotype, S=Sex, T=Treatment, x=interation.
d Average weight of all pigs at end of trial.
e Days to Market adjusted to 250 lb.
Table 5. Continuous flow environment carcass characteristics.
Environment |
CON |
|
|
|||||||
|---|---|---|---|---|---|---|---|---|---|---|
Genotype |
EUR |
YL/Dur |
|
|
||||||
Sex |
Barrows |
Gilts |
Barrows |
Gilts |
|
|
||||
Treatment |
Vac. |
Cont. |
Vac. |
Cont. |
Vac. |
Cont. |
Vac. |
Cont. |
C.V. |
Significancec |
Carcass meas.a |
||||||||||
|
10th rib backfat |
.83 |
.78 |
.71 |
.63 |
.87 |
.91 |
.73 |
.80 |
26.2 |
G*** E* GxT* S*** |
|
Last rib BF (midline) |
1.0 |
.92 |
.93 |
.82 |
1.03 |
1.06 |
.97 |
.98 |
20.1 |
G*** GxT* S*** |
|
Last lumbar BF (midline) |
.82 |
.73 |
.76 |
.61 |
.88 |
.90 |
.82 |
.78 |
25.0 |
G*** E' T* GxT' S*** |
|
Loin eye area (in2) |
7.0 |
7.1 |
7.5 |
7.6 |
6.7 |
6.9 |
7.7 |
7.3 |
9.3 |
E* S*** GxExS' |
|
Lean %b |
56.1 |
56.8 |
58.4 |
59.4 |
54.9 |
54.9 |
58.6 |
56.9 |
4.7 |
G** S*** |
Length |
32.4 |
32.4 |
32.4 |
32.6 |
32.3 |
31.8 |
32.3 |
31.9 |
2.4 |
G*** |
Color |
2.04 |
2.17 |
2.07 |
2.24 |
1.99 |
1.96 |
1.88 |
2.17 |
25.5 |
G' E' TxS* |
Marbling |
1.65 |
1.56 |
1.52 |
1.50 |
1.88 |
1.87 |
1.73 |
1.57 |
38 |
G' S*** |
Firmness |
2.10 |
2.15 |
2.15 |
2.20 |
2.41 |
2.2 |
2.16 |
2.38 |
27.8 |
S' ExS' |
|
24-hr postmor. pH |
5.48 |
5.61 |
5.49 |
5.61 |
5.68 |
5.67 |
5.56 |
5.65 |
3.7 |
G** E** |
|
24-hr drip loss % |
2.53 |
3.03 |
5.11 |
3.80 |
1.18 |
1.30 |
1.49 |
1.75 |
67.5 |
G*** GxS' |
|
Total drip loss % |
11.8 |
12.9 |
14.7 |
13.4 |
8.3 |
7.3 |
10.2 |
9.7 |
30.0 |
G*** ExS** |
L* |
57.6 |
57.7 |
58.5 |
58.5 |
57.3 |
56.8 |
57.8 |
56.8 |
5.5 |
|
a* |
8.7 |
8.4 |
8.0 |
7.9 |
8.8 |
8.0 |
9.0 |
9.3 |
18.7 |
E* GxS* TxS' GxTxS' |
b* |
12.9 |
12.2 |
12.7 |
12.4 |
12.7 |
12.7 |
12.5 |
11.3 |
10 |
E** T' GxExS* GxTxS* |
|
Grade premium $d |
3.14 |
3.09 |
4.41 |
3.67 |
2.13 |
1.86 |
2.68 |
2.45 |
90.9 |
G* E* GxE' S* |
a Values adjusted for slaughter group and carcass weight.
b Values calculated from NPPC 1991 Procedures to Evaluate Market Hogs
(5% Fat).
c Significance P-values: ' P<.10, * P<.05, ** P<.01, ***
P<.001; E=Environment, G=Genotype, S=Sex, T=Treatment, x=interation.
d Actual grade premium from IBP kill sheets ($/cwt carcass).
Table 6. Segregated early weaned environment carcass characteristics.
Environment |
SEW |
|
|
|||||||
|---|---|---|---|---|---|---|---|---|---|---|
Genotype |
EUR |
YL/Dur |
|
|
||||||
Sex |
Barrows |
Gilts |
Barrows |
Gilts |
|
|
||||
Treatment |
Vac. |
Cont. |
Vac. |
Cont. |
Vac. |
Cont. |
Vac. |
Cont. |
C.V. |
Significancec |
Carcass meas.a |
||||||||||
|
10th rib BF |
.89 |
.86 |
.74 |
.73 |
.88 |
.94 |
.81 |
.82 |
26.2 |
G*** E* GxT* S*** |
|
Last rib BF (midline) |
1.04 |
.99 |
.94 |
.87 |
1.03 |
1.09 |
.99 |
.98 |
20.1 |
G*** GxT* S*** |
|
Last Lumbar BF (midline) |
.87 |
.87 |
.76 |
.69 |
.87 |
.90 |
.86 |
.84 |
25.0 |
G*** E' T* GxT' S*** |
|
Loin eye area (in2) |
7.3 |
7.1 |
7.9 |
7.6 |
7.5 |
7.2 |
7.3 |
7.5 |
9.3 |
E* S*** GxExS' |
|
Lean %b |
56.1 |
55.9 |
58.7 |
58.4 |
56.5 |
55.4 |
57.1 |
55.4 |
4.7 |
G** S*** |
Length |
32.4 |
32.3 |
32.5 |
32.6 |
31.9 |
31.9 |
32.1 |
32.3 |
2.4 |
G*** |
Color |
2.38 |
2.31 |
2.03 |
2.33 |
2.32 |
2.02 |
2.06 |
2.23 |
25.5 |
G' E' TxS* |
Marbling |
1.73 |
1.83 |
1.41 |
1.39 |
1.92 |
1.81 |
1.36 |
1.52 |
38 |
G' S*** |
Firmness |
2.21 |
2.36 |
1.99 |
2.22 |
2.52 |
2.29 |
1.98 |
2.09 |
27.8 |
S' ExS' |
|
24-hr postmor. pH |
5.38 |
5.43 |
5.47 |
5.42 |
5.54 |
5.56 |
5.45 |
5.55 |
3.7 |
G** E** |
|
24-hr drip loss % |
3.94 |
3.19 |
3.79 |
4.04 |
2.87 |
2.73 |
2.23 |
1.72 |
67.5 |
G*** GxS' |
|
Total drip loss % |
14.8 |
13.6 |
12.8 |
14.3 |
11.0 |
11.6 |
11.0 |
8.3 |
30.0 |
G*** ExS** |
L* |
58.7 |
58.0 |
57.8 |
57.0 |
57.4 |
57.8 |
57.8 |
55.6 |
5.5 |
|
a* |
9.1 |
9.3 |
8.9 |
9.1 |
9.7 |
8.1 |
9.2 |
10.3 |
18.7 |
E* GxS* TxS' GxTxS' |
b* |
13.9 |
13.5 |
13.1 |
13.0 |
12.5 |
12.9 |
13.6 |
12.5 |
10 |
E** T' GxExS* GxTxS* |
|
Grade premium $d |
1.42 |
2.06 |
2.89 |
2.85 |
1.75 |
1.96 |
2.28 |
2.18 |
90.9 |
G* E* GxE' S* |
a Values adjusted for slaughter group and carcass weight.
b Values calculated from NPPC 1991 Procedures to Evaluate Market Hogs
(5% Fat).
c Significance P-values: ' P<.10, * P<.05, ** P<.01, ***
P<.001; E=Environment, G=Genotype, S=Sex, T=Treatment, x=interation.
d Actual grade premium from IBP kill sheets ($/cwt carcass).
Table 7. Segregated early weaned environment pork quality.
Environment |
SEW |
|
|
|||||||
|---|---|---|---|---|---|---|---|---|---|---|
Genotype |
EUR |
YL/Dur |
|
|
||||||
Sex |
Barrows |
Gilts |
Barrows |
Gilts |
|
|
||||
Treatment |
Vac. |
Cont. |
Vac. |
Cont. |
Vac. |
Cont. |
Vac. |
Cont. |
C.V. |
Significancea |
Carcass meas. |
||||||||||
|
Shear Force, kg |
5.21 |
5.04 |
4.96 |
4.92 |
6.02 |
5.58 |
5.51 |
5.56 |
15.8 |
G** GxT* GxExT* |
|
Cooking Loss % |
32.4 |
29.3 |
31.6 |
31.5 |
31.5 |
28.6 |
26.9 |
30.2 |
14.9 |
G*** ExS* TxS* |
|
Moisture % |
74.0 |
74.2 |
74.1 |
74.3 |
73.4 |
73.8 |
73.6 |
73.8 |
1.15 |
G*** E* |
|
Intra-muscular fat % |
2.30 |
2.09 |
1.63 |
1.77 |
2.85 |
1.81 |
1.92 |
2.29 |
34.5 |
G** E** T' S** TxS* |
Taste Panelb |
||||||||||
|
Tenderness |
7.32 |
6.75 |
6.62 |
7.34 |
5.80 |
5.40 |
5.55 |
5.88 |
23.5 |
G* E' GxE** ExTxS' |
|
Juciness |
7.02 |
6.66 |
6.82 |
7.25 |
5.13 |
5.25 |
5.30 |
5.84 |
24.4 |
G*** GxE** GxT* ExS* |
|
Off-Flavor |
14.3 |
14.8 |
14.3 |
13.3 |
14.7 |
14.6 |
14.8 |
14.5 |
5.0 |
G** ExS* GxExS** TxS* |
a Significance P-values: ' P<.10, * P<.05, ** P<.01, ***
P<.001; E=Environment, G=Genotype, S=Sex, T=Treatment, x=interation.
b Taste panel measurements use a 15 cm structured line scale with 0
cm being extremely dry, tough, and intense off-flavor, and 15 cm being extremely
moist, tender and no off-flavor.
Table 8. Continuous flow environment pork quality.
Environment |
CON |
|
|
|||||||
|---|---|---|---|---|---|---|---|---|---|---|
Genotype |
EUR |
YL/Dur |
|
|
||||||
Sex |
Barrows |
Gilts |
Barrows |
Gilts |
|
|
||||
Treatment |
Vac. |
Cont. |
Vac. |
Cont. |
Vac. |
Cont. |
Vac. |
Cont. |
C.V. |
Significancea |
Carcass meas. |
||||||||||
|
Shear Force, kg |
5.10 |
6.05 |
5.04 |
5.68 |
5.49 |
5.39 |
6.28 |
5.42 |
15.8 |
G** GxT* GxExT* |
|
Cooking Loss % |
32.4 |
31.3 |
33.3 |
34.3 |
28.1 |
25.8 |
30.7 |
30.0 |
14.9 |
G*** ExS* TxS* |
|
Moisture % |
74.7 |
74.7 |
74.6 |
74.4 |
73.8 |
73.9 |
73.9 |
74.1 |
1.15 |
G*** E* |
|
Intra-muscular fat % |
1.85 |
1.46 |
1.51 |
1.44 |
2.23 |
2.20 |
1.79 |
1.53 |
34.5 |
G** E** T' S** TxS* |
Taste Panelb |
||||||||||
|
Tenderness |
6.35 |
6.95 |
6.91 |
6.95 |
7.23 |
7.63 |
6.51 |
5.90 |
23.5 |
G* E' GxE** ExTxS' |
|
Juciness |
6.95 |
6.27 |
6.71 |
5.76 |
6.24 |
7.82 |
5.12 |
5.70 |
24.4 |
G*** GxE** GxT* ExS* |
|
Off-Flavor |
14.2 |
14.1 |
14.8 |
14.7 |
14.8 |
14.9 |
14.7 |
14.5 |
5.0 |
G** ExS* GxExS** TxS* |
a Significance P-values: ' P<.10, * P<.05, ** P<.01, ***
P<.001; E=Environment, G=Genotype, S=Sex, T=Treatment, x=interation.
b Taste panel measurements use a 15 cm structured line scale with 0
cm being extremely dry, tough, and intense off-flavor, and 15 cm being extremely
moist, tender and no off-flavor.

Figure 1. Mycoplasma exposure, environment and treatment means. CON = Continous flow environment; SEW = Segregated early weaned, three-site environment; Cont = Control treatment, no vaccination nor feed medication; Vac = Vaccinated and medicated feeds.
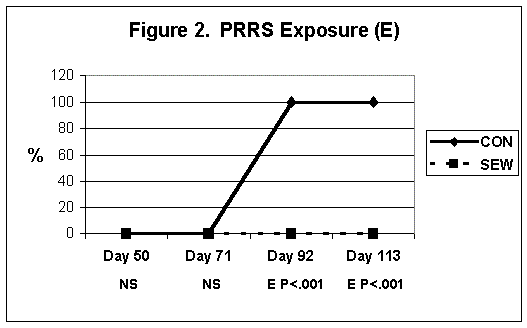
Figure 2. PRRS exposure, environment means. CON = Continous flow environment; SEW = Segregated early weaned, three-site environment.
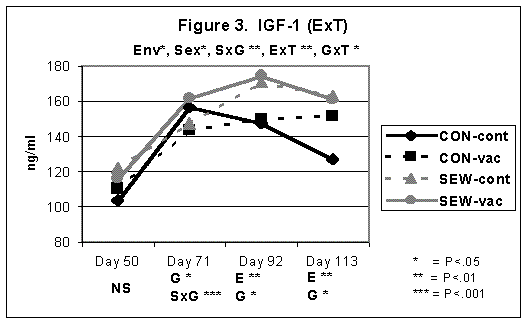
Figure 3. Insulin-like growth factor-1, environment and treatment means. CON = Continous flow environment; SEW = Segregated early weaned, three-site environment; Cont = Control treatment, no vaccination nor feed medication; Vac = Vaccinated and medicated feeds.
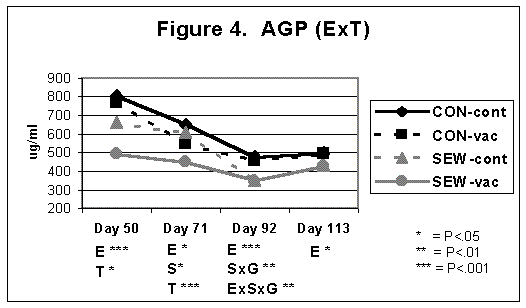
Figure 4. Alpha 1-acid glycoprotein, environment and treatment means. CON = Continous flow environment; SEW = Segregated early weaned, three-site environment; Cont = Control treatment, no vaccination nor feed medication; Vac = Vaccinated and medicated feeds.
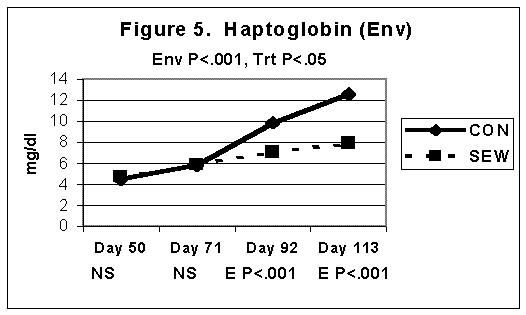
Figure 5. Haptoglobin, environment means. CON = Continous flow environment; SEW = Segregated early weaned, three-site environment.
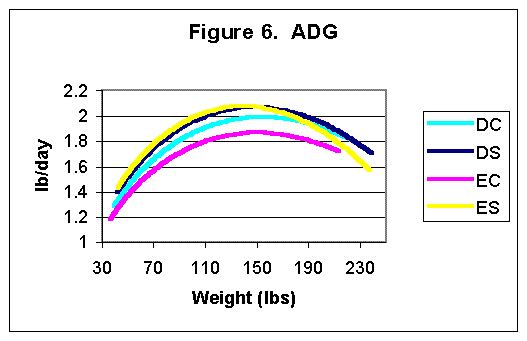
Figure 6. Average daily gain for each genotype in the two
environments.
Genotypes: D = Yorkshire-Landrace x Duroc cross; E = European terminal
cross.
Environments: C = Continuous flow; S = Segregated early weaned,
three-site.
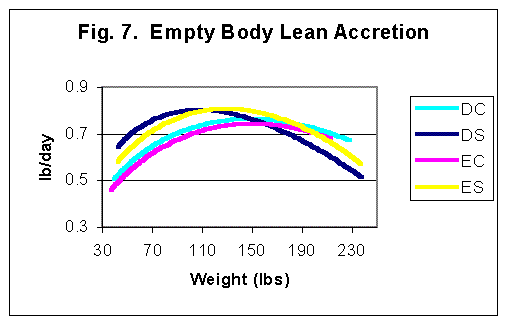
Figure 7. Empty body lean accretion curves for each genotype in the two
environments.
Genotypes: D = Yorkshire-Landrace x Duroc cross; E = European terminal cross.
Environments: C = Continuous flow; S = Segregated early weaned, three-site.
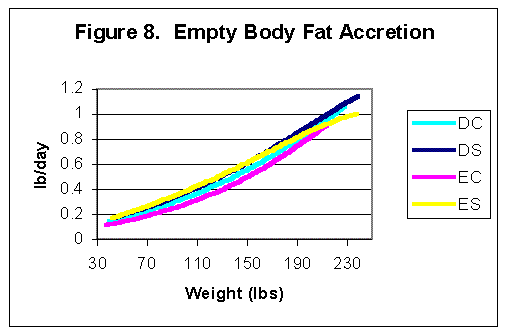
Figure 8. Empty body fat accretion curves for each genotype in the two
environments.
Genotypes: D = Yorkshire-Landrace x Duroc cross; E = European terminal cross.
Environments: C = Continuous flow; S = Segregated early weaned, three-site.
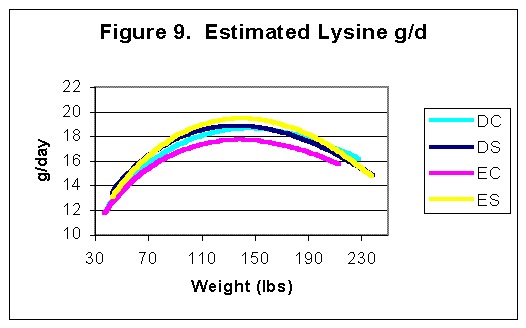
Figure 9. Estimated lysine requirement for each genotype in the two
environments.
Genotypes: D = Yorkshire-Landrace x Duroc cross; E = European terminal cross.
Environments: C = Continuous flow; S = Segregated early weaned,
three-site.
Index of 1999 Purdue Swine Day Articles
If you have trouble accessing this page because of a disability, please email anscweb@purdue.edu.