Purdue University 1999 Swine Day Report
A.P. Schinckel, B.T. Richert, J.W. Frank, and D.C. Kendall
Department of Animal Sciences
The pork industry is driven by consumer demand for consistent quality, lean pork products. To meet consumer demand, the pork industry must continue to improve the efficiency of lean pork production. The two primary approaches for improving the efficiency of pork production are through genetic and environmental-management changes.
Each commercial producer must first decide which genetics should be used in their production facility. After making the key genetic decisions, each pork producer must consider cost-effective management changes to optimize the expression of the genetic potential of their pigs. A number of alternative management decisions must be evaluated which are influenced by production costs (i.e., feed, facilities, labor and interest costs) and the relative rate of payment for carcass lean versus fat in the marketing system.
Substantial differences in performance exist between different environments and health management strategies. Environmental factors including disease exposure, social stress, and less than optimal stocking density limit growth, such that pigs managed under commercial conditions are unlikely to express their maximum potential protein accretion, even when allowed ad libitum access to a high quality, nutrient dense diet. In a past trial, pigs with minimal diseases via segregated early weaning (SEW), which were fed a series of non-limiting diets, achieved 230 lb at 136 days of age and 264 lb at 151 days of age (Schinckel et al., 1995). Pigs raised on the original commercial farm, conventionally weaned with all-in, all-out production, required 184 days to attain 230 lb live weight. In a second trial, pigs moved to a research building with 3 pigs per pen and 24 ft2 per pig grew 42% faster than pigs reared on the commercial farm (Holck et al., 1998). These types of observations are prompting producers to make health management changes.
To produce quality lean pork more efficiently, the direct effects and interactions between genetic potential for lean growth and health-management level must be understood. Producers need to have some expectations as to the magnitude of performance changes as a result of both genetic and health status changes. Therefore, three genotype by environmental interaction trials were completed. The objectives of these studies were to evaluate possible interactions between genetic potential for lean growth, sex, antibiotic treatment, and health status environments on lean gain and pork quality.
From 1988 to 1995, a series of lean growth trials were conducted to evaluate the maximum achievable lean growth rates of various genetic populations. Pigs were tested at the old Indiana boar test station during the spring and fall seasons. Pigs were provided 24 ft2 in the open-front building. In 1989, 236 pigs were obtained from 18 midwest seedstock producers and their commercial customers. Thirty-two different combinations of seedstock source and breed (or breed cross) were tested in pens of three or six head (54 total pens). The barrows were fed a high energy, 16% crude protein, .90% lysine commercial grower diet (1630 Mcal ME/lb). The barrows were slaughtered weekly as close to 230 lb as possible. Pounds of lean was predicted by a four-variable equation that included hot carcass weight, loin eye area, 10th rib backfat depth, and last rib midline backfat thickness. Liveweight and lean feed conversion were estimated for each pen. Lean efficiency (lb feed/lb fat-free lean) ranged from 7.5 to 8.2 for the more efficient pigs and 11.0 to 13.7 for the low lean gain pigs from 70 to 230 lb live weight.
The 1989 data were analyzed to examine the percentage of the total variation in lean growth and carcass merit that could be accounted for by breed composition and heterosis. Approximately 15-25% of the total variation in lean growth and carcass traits was explained by the breed composition and heterosis effects. Within any breed cross there was a large amount of variation. The selection practices of each seedstock supplier were substantially more important than the breed composition. This data clearly demonstrated that for lean growth rate and carcass merit, the breed composition alone doesn't define the lean growth potential of the pigs produced.
In many cases, commercial producers would record the growth rate and carcass composition of their pigs compared to those tested under ideal conditions. In almost all cases, pigs reported to have .7 to .8 inch backfat under commercial conditions would be slightly fatter (.8 to 1.0 inch) under ideal conditions. However, pigs with 1.0 to 1.2 inch backfat under commercial environments would have 1.4 to 1.7 inch backfat when reared under the more ideal conditions. In the 1992 through 1995 lean growth trials, pigs were supplied from recently imported European lines (Schinckel et al., 1994, 1996). These pigs had been selected for increased lean percentage, improved lean efficiency, and reduced feed intakes (Schinckel, 1994). In the 1995 lean growth trials (Table 3), European terminal cross pigs were compared to U.S. terminal cross pigs (Hampshire x Yorkshire-Landrace, Duroc x Yorkshire-Landrace, and primarily Hampshire-Duroc x Yorkshire-Landrace). The U.S. pigs in the 1995 trials had higher fat-free lean growth rates (.68 lb/day vs. .60 lb/day) and better lean conversion (8.45 vs. 10.2 lb feed/lb fat-free lean) than U.S. pigs in the 1989 trial. The European terminal cross pigs had 13.2% lower feed intakes (4.49 vs. 5.75 lb/day), 5.5% higher lean growth rates (.718 vs .680 lb/day), and 17.1% better fat-free lean conversion (7.00 vs. 8.45). Their improved lean efficiency was primarily a result of a 26.3% (.42 vs. .57) reduction in daily carcass fat gain. This difference in daily carcass fat gain accounts for approximately .60 lb daily feed intake.
Commercial producers rearing the European terminal cross pigs were surprised by our results as compared to their on-farm performance. These pigs reared under the more ideal conditions were approximately .1 inch leaner and .4 to .5 more feed efficient than those reared commercially. These responses could be partially explained by nutritional energy intake differences between the commercial and ideal environments. The high lean growth, low feed intake research pigs were fed high lysine, high density diets. The feed intakes that these high lean gain pigs achieved under ideal conditions may have been near optimal to minimize their live weight and lean feed conversion.
During the early to mid 1990's, commercial producers, swine industry technical consultants and veterinarians all reported that these lower feed intake, high percent lean pigs appeared to be more environmentally sensitive. Some pork producers and their consultants summarized their grow-finish records before, during, and after disease breaks. The lean genetics appeared to have larger than average reductions in growth rate and increased feed conversion ratios (feed/gain) during and after disease outbreaks. A large Illinois producer summarized records of U.S.-European terminal cross pigs and lean, low feed intake European terminal cross pigs. Before a disease outbreak, the lean European terminal cross pigs required 7 to 10 more days to market then the other pigs. During and after a disease outbreak, the lean European pigs required 21 to 30 additional days to market in comparison to the other terminal cross pigs.
These field reports suggested the existence of genetic by environmental interactions with the low feed intake, lean genotypes being more sensitive to environmental stressors. However, with most field records there were confounding factors that may have partially accounted for the observations. To clearly document and quantify genetic by environmental interactions, carefully designed research trials were required. Therefore, to substantiate and quantity the magnitude of genetic by environmental interactions, three genetic by environmental trials were conducted.
In each trial, two or three genetic populations of pigs were reared under two health status environments: (1) segregated early weaning, three-site (EW), and (2) conventional weaning, continuous flow grow-finish (CF). In each trial, two feed growth promotant or feed growth promotant/vaccination treatments were assigned to pigs of each genetic population in each environment.
Two-hundred eighty-eight pigs were evaluated from two genetic populations: a European Terminal cross (ETC) with a high potential for lean growth and low to moderate feed intake, and a Yorkshire-Landrace cross (YL) with an average potential for lean growth and feed intake (Frank et al., 1997). The pigs were assigned within each genetic population and sex to either a control diet (non-medicated) or a diet containing 50 g/ton carbodox in the nursery and 30 g/ton bacitracin methylene disalicylate (BMD) in the grow-finish.
During the trial, pigs in the EW environment grew faster and had high feed intakes in the nursery and from 53 to 101 days of age. At approximately 85 days of age, the pigs became serologically positive for PRRS and mycoplasma. From 101 to 142 days of age in the EW environment, average daily gains dropped, while feed intakes rose. At the end of the trial, there was no statistical difference in days to 250 lb between the EW and CF environments.
In this trial, there were significant genetic by environmental interactions for average daily gain, daily feed intake, days to market, backfat thickness, percent lean and death loss. The ETC gilts become leaner in the EW environment than in the CF environment (.52 vs. .60 inch backfat, 60.5 vs. 58.4% lean). The ETC barrows had no difference in lean between environments (.74 vs. .76 inch backfat, 54.5 vs. 54.7% lean). The YL gilts raised in the EW environment had more 10th rib backfat (.89 vs. .76 inch) and lower percent lean (51.8 vs. 53.2%). The YL barrows became substantially less lean (1.18 vs. 1.00 inch backfat, 48.0 vs. 49.7% lean) in the EW environment.
The ETC pigs had significantly higher death loss (18.5 versus 5.6%) in the CF environment compared to the YL pigs. No significant differences were observed in death loss between the ETC and YL pigs in the EW environment (3.57 versus 2.28%). There was also a significant environment x sex interaction for days to market, as the barrows required 9.6 less days than gilts (185.5 vs. 195.1) in the EW environment and 2.7 more days (192.7 vs. 190.0) in the CF environment. Environment by treatment interactions, when significant, were the result of a greater response in the continuous flow environment. When genotype x treatment interactions were significant, they were the result of a greater response in the ETC cross pigs.
Three terminal sire lines were used (L, M and H), respectively increasing in genetic potential for percent lean (Frank et al., 1998); these were bred to European Landrace x Duroc-Large White sows. Previous data had shown that the L genotype had the highest live weight growth rate, feed intake, and lipid accretion, and the H genotype had the lowest live weight growth rate, feed intake, and lipid accretion. The M genotype was a cross of the L and H genotypes. All three sire genotypes had similar lean accretion rates when evaluated in prior trials. At total of 320 pigs were included in this trial. The treatments were no vaccination with non-medicated diets from 50 to 91 days (C), or Mycoplasma hyopneumoniae vaccination (Respisure®) on days 28 and 42 followed by two veterinary feed directives of 272 g/ton Tilmicosin (Pulmotil#174;) from days 50 to 70 and days 71 to 91 (VT). After this treatment period, all pigs consumed diets containing 40 g/ton Tylosin.
In this trial, the EW pigs converted for PRRS and mycoplasma during the finisher period between 112 to 133 days of age. There were no differences in days to 250 lb between the EW and CF environments (Table 4). There were significant genetic (sire line) by environment interactions for average daily gain, days to 250 lb, feed efficiency and morbidity. In the CF environment, pigs sired by the L sires grew 21 lb/day faster and required 12.3 less days to market than the H-sired pigs. There were no sire line differences in feed efficiency (gain/feed) in the CF environment. In the EW environment, there were no sire line differences for average daily gain or days to maket. There were significant sire line differences for feed efficiency in the EW environment. Pigs of the H line had the best feed efficiency (.372), pigs of the L line were lowest (.344), and M-sired pigs were intermediate (.357).
Two hundred eighty-eight pigs of two genetic populations were evaluated. Yorkshire-Landrace sows were bred to U.S. Duroc sires selected for high live weight growth EPDs (YL/Dur), and European Landrace-Large White/Duroc sows were mated to European Duroc-Hampshire F1 sires (EUR). Two treatments were imposed after a common medication program in the nursery. Half the pigs were vaccinated (VAC) with Respisure® and given feed grade antibiotics through the finisher [272 g/ton Tilmiconsin (Pulmotil®) from 50-70 days of age followed by 40 g/ton Tylosin to market weight (250 lb)]; half were non-vaccinated and non-medicated (CONT). Based on data from the 1994 and 1995 lean growth trials, it was expected that the differences between the EUR and YL/Dur pigs would be 0.2 to 0.3 inches for backfat thickness and 2.5 to 3.0% fat-free lean. However, likely due to genetic selection with U.S. purebred genetics and incorporation of some European genetics (Danish sires into Durocs and Swedish sires into the Yorkshires and Landrace), the differences observed (.09 inch backfat and 1.15% lean) were smaller than expected. The carcass premium advantage of the EUR over the YL/Dur was $1.23 per carcass cwt or $2.28 per pig.
For 30 to 51 days of age, there were genetic by environmental interactions for both ADG (P<.01) and ADFI (P<.05), with the two genotypes performing nearly identically in the EW environment. However, both feed intake and growth of the EUR pigs was less than the YL/Dur in the less optimum CF environment. During the first grow-finish stage, 51 to 72 days of age, the EW pigs had higher ADG (1.48 vs. 1.41). There were also a 10% increase in ADG and an 8% increase in ADFI for the pigs on the VAC treatment (P<.001). Genetic by environment interactions for both ADG (P<.001) and ADFI (P<.05) from 72 to 114 days of age occurred. The EUR pigs performed substantially better in the EW environment (1.97 ADG, 4.71 ADFI) in relation to the CF environment (1.73 ADG, 4.03 ADFI), while the YL/Dur pigs had similar performance in the EW environment (1.91 ADG, 4.85 ADFI) and the CF environment (1.89 ADG, 4.64 ADFI). An environment by treatment interaction for ADG (P<.01) and ADFI (P<.05) existed, as the two treatments showed very little difference in the EW environment (1.96 vs. 1.92 lb/day ADG), but the VAC pigs had better performance in the CF environment (1.91 vs. 1.70 lb/day ADG). EUR pigs tended (P=.20) to show a greater treatment response than the YL/Dur pigs (+.28 vs. +.15 lb/day ADG) in the CF environment.
Days to market showed major differences between the performance of the animals in the two environments (P<.001). The YL/Dur genotype had better overall days to market by 4 days (P<.05). Also, a genetic by environment interaction existed (P<.01) for days to market. The EUR pigs took one day less to 250 lb than the YL/Dur pigs in the EW environment, but were 10 days slower in the CF environment.
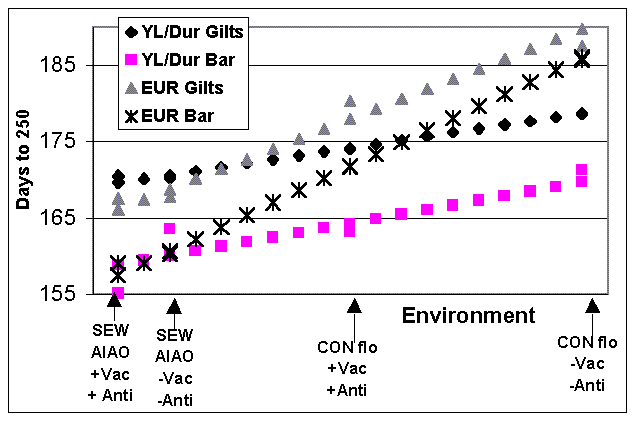
The days to market data were then analyzed with regression to evaluate the environmental sensitivity of each genotype-sex population. The performance of each genetic population-sex group was regressed on the overall mean performance of each health environment-treatment (Figure 1). This type of analysis is commonly used for different plant crosses evaluated under different test plots. The average regression coefficient by design has a value of one. Genetic populations more sensitive to the environmental stressors of the poor performing environments have a value greater than one. Genetic populations that perform more consistently across environments have regression coefficients less than one.
The regression coefficients (b) were significantly higher (P=.0034) for the EUR barrows (b=1.58) and gilts (b=1.31) than for the YL/Dur barrows (b=.60) and gilts (b=.51). Thus overall, the EUR pigs are 2.6 times more sensitive to the environmental stressors of the lower performing CF environment. This characteristic of overall environmental sensitivity is a genetic trait of the genetic population.
The three trials conclusively document the existence of genetic by environmental interactions. The trials support the observations of pork producers and their technical advisors that some genetic populations selected for leanness and reduced feed intakes are more sensitive to environmental stressors then some higher feed intake U.S. genetic populations.
In the first two trials, the overall performance for growth rate was similar for the EW and CF environment. This was likely due to the PRDC (porcine respiratory disease complex) outbreak in the EW environment. Also, during the winter months, during a time of minimal ventilation rates, the air quality worsened. The scraper system in the EW grow-finish building produces ammonia. The CF environment had more early signs of respiratory disease with increased early grower mortality and overall higher levels of morbidity.
Thus, for the first two trials, the two environments likely had different stressors occurring at different ages. In the first trial, the lean ETC gilts became leaner in the EW environment. The largest loin eye areas (10 to 12.6 in2) and percent lean (greater than 57% fat-free lean) were from ETC gilts in the EW environment. These gilts which only demonstrated their high potential for percent lean in the EW environment had the highest death loss (21%) in the CF environment. In other words, the 21% of the gilts who did not survive to market day may have been genetically leaner than the ETC gilts which survived to market. With such a high death loss in the ETC gilts reared in the CF environment, it is possible that the reduced percent lean in the ETC-CF gilts could have been caused by the genetically leanest of the ETC gilts having a higher probability of mortality in the CF environment.
In the second trial, three different terminal sire lines were evaluated in the two environments. Significant genetic by environmental interactions existed for growth and feed efficiency. Pigs by the lower percent lean, high feed intake sire line grew 12.3 days faster than pigs by the high percent lean sire line in the CF environment, but required 3.7 more days than pigs by the high percent lean sire line in the EW environment. The economic advantage of the leanest sire line could only be realized in the high health environment. Genetic differences between sire lines are estimated as two times the difference between the progeny groups. The resulting estimates of genetic merit of the two sire lines is a 24.6 day advantage for days to 250 lb for the L line versus the H line in the CF environment, compared to a 7.4 day disadvantage in the EW environment. In the estimation of sire line effects, the genotype by environmental interaction for days to market are equivalent to five genetic standard deviations using NSIF parameters (h2=.25, phenotypic standard deviation = 12 days, genetic standard deviation = 6 days).
The third trial demonstrated that pigs of similar percent lean and similar breed composition may have drastically different responses to environmental stressors. In the EW environment, the EUR pigs took one day less to market than the YL/Dur pigs, but were 10 days slower in the CF environment. The results would suggest that either the environment in which the EUR pigs were selected or the selection criteria and relative emphasis placed on the postweaning traits (feed intake, fat growth, lean growth, and backfat thickness) has resulted in pigs which are more environmentally sensitive.
In a recent nutrition trial, lean gilts sired by lean European sires on the same Landrace by Large White-Duroc dams were reared in the west and east wing of the EW grow-finish facility. In the west wing, the lean gilts grew faster (2.06 vs. 1.76 average daily gain) and had higher daily feed intakes (5.33 vs. 4.94 lb/day), but were leaner (.54 vs. .62 inch backfat) and had larger loin eye areas (7.6 vs. 7.4 in2). The ventilation of the east wing (totally enclosed) does not provide the air quality of the curtain sided west wing during the fall. In this project, death loss was low and few animals were treated for signs of infectious disease. The results of this trial suggest that the environmental stressors (air quality) reduce lean growth to a greater extent than fat growth, such that at these lower feed intakes, percent lean is reduced.
With the magnitude of genetic by environmental interactions observed in these trials it becomes obvious that (1) evaluation of different genetic populations (either the progeny of different terminal sire lines or completely different genetic populations) in one environment cannot be used to predict the performance of pigs reared in a different environment, and (2) substantial economic benefits could be realized if genetic by environmental interactions could be utilized by identifying the "optimal" sire for a quantified production facility "environment". The question remains, how does one quantify the production environment? Average performance levels such as days to 250 lb are not adequate, as significant genetic by environmental interactions existed in trials I and II without any significant difference between the environments for days to 250 lb.
The evaluation of different genetic populations in different environments is one of a number of means to demonstrate genetic by environmental interactions. Genetic correlations of less then unity have been reported by numerous researchers for growth rate between pigs tested in central test stations versus on-farm conditions.
Another means to demonstrate genetic by environmental interactions is to compare the environmental trends of different genetic lines reared over time in the same facilities. The observation of different environmental trends for each line indicate the presence of genotype by environmental interactions. Without genotype by environmental interactions, the predicted environmental trends should be similar for each genetic population. Several seedstock suppliers have observed substantially different environmental trends for their different genetic populations reared in the same facilities.
Genetic by environmental interactions can be caused by a number of underlying physiological events. Lean, low feed intake lines have been found to be more sensitive to heat stress (Nienaber et al., 1997) and immune system activation (Stahly, 1994; Leninger et al., 1998). Significant genetic by environmental interactions have been found for circulation levels of IGF-1 and measures of cytokines and immune system response proteins (McComb et al., 1997).
The significance of genetic by environmental interactions and different environmental sensitivity of different populations found in these four studies has broad implications for future genetic evaluation, lean growth modeling and environmental physiology research. Obviously, evaluation of different genetic populations in one environment can only be interpreted as the difference observed in that specific environment. Even if two farms have similar performance levels, different genetic populations may respond differently to the different environmental stressors in each environment.
A researcher conducting research on the effect of any environmental stress (pigs/pen, pen density, air quality, heat or cold stress, antigen challenge, disease air quality) must be careful to realize that the responses observed will likely differ depending upon the genetic population and any additive underlying stressors.
In the past for simplicity, it has been assumed that the magnitude of genetic by environmental interactions were extremely small and insignificant. As profit margins become smaller as the swine industry matures, it will become increasingly important that genetic by environmental stressors be researched and utilized - not ignored.
Frank, J.W., B.T. Richert, A.P. Schinckel, B.A. Belstra, M. Ellis, and A.L. Grant. 1997. Effects of environment, genotype, sex, and antibiotic treatment on pig growth, carcass characteristics, and pork quality. Purdue 1997 Swine Day Report. p. 13-22.
Frank, J.W., B.T. Richert, A.P. Schinckel, B.A. Belstra, S.F. Amass, and S.A. DeCamp. 1998. Effects of environment, genotype, and health management system on pig growth and carcass characteristics. Purdue 1998 Swine Day Report. p. 129-140.
Holck, J.T., A.P. Schinckel, J.L. Colemena, V.M. Wilt, G. Christenson, E.L. Thacker, M. Spurlock, A.L. Grant, M.K. Senn, and B.J. Thacker. 1998. The influence of environment on the growth of commercial finisher pigs. Swine Health and Prod. 6(4):141-149.
Leninger, M.T., C.P. Portocarrero, C.A. Bidwell, M.E. Spurlock, J.N. Nielsen, and K.L. Houseknecht. 1998. Effect of immune challenge on different genotypes: How sick can they get? Purdue 1998 Swine Day Report. p. 1-8.
McComb, M.A., J.W. Frank, A.P. Schinckel, M.E. Spurlock, B.T. Richert, P.J. Malven, and A.L. Grant. 1997. J. Anim. Sci. Vol. 75(Suppl. 1):85(abstr.).
Nienaber, J.A., G.L. Hahn, R.A. Eigeneg, R.L. Korthals, J.T. Yen, and D.L. Harris. 1997. Genetic and heat stress interaction effects on finishing swine. Proc. Fifth Intern. Sym. Livestock and Environment Amer. Sol. of Agric. Eng. Vol II, p. 1017-1023.
Schinckel, A.P. 1994. Nutrient requirements of modern pig genotypes. In: Recent Advances in Animal Nutrition. P.C. Garnsworthy and D.J.A. Cole, Ed. Univ. of Nottingham Press, Nottingham, U.K. p.133.
Schinckel, A.P., L.K. Clark, G. Stevenson, K. Knox, J. Nielsen, A. Grant, J.J. Turek, and D. Hancock. 1995. Effects of antigenic challenge on growth and composition of segregated early-weaned pigs. Swine Health and Production 3(6):228-234.
Schinckel, A.P., J.C. Forrest, E. Berg, E. Sheiss, and M.E. Einstein. 1996. Swine lean growth and pork quality evaluation trials. Purdue 1996 Swine Day Report. p. 11-17.
Schinckel, A.P., J.C. Forrest, M.E. Einstein, and C. Robson. 1994. Swine lean growth evaluation trials. Purdue 1994 Swine Day Report. p. 91-95.
Stahly, T.S., N.H. Williams, and S.G. Swenson. 1994. Interactive effects of immune system activation and lean growth genotype on growth of pigs. Iowa State Univ. 1994 Swine Research Reports. p. 33-35.
Table 1. Postweaning performance and carcass merit for a sample of pigs - 1989a.
|
Mean |
SD |
Range |
|---|---|---|---|
Daily Feed Intake |
5.92 |
.32 |
5.34 - 6.98 |
Average Daily Gain |
2.19 |
.23 |
1.51 - 3.08 |
lb Feed/lb Live Weight Gain |
2.74 |
.15 |
2.40 - 3.09 |
Backfat Depth, 10th Rib, in. |
1.26 |
.30 |
.40 - 2.2 |
Loineye Area, in2 |
4.99 |
.69 |
3.3 - 7.3 |
% Fat-Free Lean, estimated |
42.89 |
4.27 |
30.1 - 59.5 |
Lean Growth Rate, lb/day |
.60 |
.11 |
.34 - .87 |
lb Feed/lb Fat-Free Lean Gain |
10.2 |
1.11 |
7.51 - 13.7 |
a Measured on 54 pens of 3 or 6 head each, 24 ft2 per pig, from 70-230 lb live weight.
Table 2. High and low performing genetic sources for lean growth and carcass merita.
Breeds |
No. Pens | Lean Growth, High or Low |
Fat-Free Lean Gain, lb/day |
Lean Eff. |
Fat-Free % Lean |
ADG, lb/day |
BF10R, inches |
LEA, in2 |
|---|---|---|---|---|---|---|---|---|
Hampshire/Duroc |
2 |
High |
.83 |
8.1 |
53.1 |
2.5 |
.75 |
6.1 |
Hampshire/Duroc |
2 |
Low |
.51 |
12.4 |
38.7 |
2.4 |
1.53 |
4.5 |
Yorkshire/Landrace |
3 |
High |
.69 |
8.1 |
49.5 |
2.1 |
.90 |
5.7 |
Yorkshire/Landrace |
4 |
Low |
.51 |
12.2 |
33.9 |
2.2 |
1.39 |
4.4 |
a Lean gain = lb carcass fat-free lean gain per day; Lean Eff. = lb feed per lb fat-free lean gain; ADG = average daily gain; BF10R = backfat at the 10th rib; LEA = loin eye area at the 10th rib.
Table 3. Performance differences observed between European and U.S. terminal crosses.a
|
ADG |
Feed Intake |
Feed/ Gain |
Fat Depth |
Fat-Free Lean Gain, lb/day |
Carcass Fat Gain, lb/day |
Lb Feed/ Lb Lean |
|---|---|---|---|---|---|---|---|
Spring 1995 Trial |
|||||||
Barrows - European |
2.11 |
4.85 |
2.30 |
.81 |
.76 |
.52 |
6.43 |
Barrows - U.S. |
2.15 |
5.42 |
2.54 |
1.24 |
.67 |
.69 |
7.95 |
Gilts - European |
1.93 |
4.38 |
2.27 |
.62 |
.72 |
.38 |
6.13 |
Gilts - U.S. |
2.07 |
5.25 |
2.52 |
1.12 |
.67 |
.56 |
7.87 |
Overall - European |
2.02 |
4.61 |
2.29 |
.72 |
.74 |
.45 |
6.28 |
Overall - U.S. |
2.11 |
5.34 |
2.53 |
1.18 |
.67 |
.63 |
7.91 |
Difference (Overall) |
-.09 |
-.73 |
-.25 |
-.46 |
.07 |
-.18 |
-1.63 |
Difference as % of U.S. |
-4.3 |
-13.7 |
-9.9 |
-39.4 |
+10.4 |
-28.6 |
-20.6 |
Fall 1995 Trial |
|||||||
Barrows - European |
1.90 |
5.59 |
2.94 |
.77 |
.667 |
.433 |
8.38 |
Barrows - U.S. |
2.16 |
6.66 |
3.07 |
1.00 |
.685 |
.575 |
9.72 |
Gilts - European |
1.72 |
5.12 |
2.96 |
.64 |
.722 |
.366 |
7.09 |
Gilts - U.S. |
1.90 |
5.63 |
2.98 |
.70 |
.700 |
.435 |
8.04 |
Overall - European |
1.81 |
5.36 |
2.95 |
.70 |
.695 |
.400 |
7.73 |
Overall - U.S. |
2.03 |
6.15 |
3.03 |
.85 |
.692 |
.505 |
8.88 |
Difference (Overall) |
-.22 |
-.79 |
.08 |
-.15 |
+.003 |
.105 |
-1.15 |
Difference as % of U.S. |
-11.9 |
-12.8 |
-2.6 |
-17.7 |
.43 |
-20.8 |
-13.0 |
a The data included three European and four U.S. terminal cross genotypes in the spring 1995 trial, and three European and three U.S. terminal cross pigs in the fall 1995 trial, with 24 or 32 pigs per genotype-sex group from 80-250 lb live weight.
Table 4. Genotype x environmental interactions for Trial IIa.
|
Continuous Flow (CF) |
Segregated Early Weaned (EW) |
|
||||
|---|---|---|---|---|---|---|---|
Genotype |
L |
M |
H |
L |
M |
H |
SE |
Average Daily Gain |
2.03 |
1.89 |
1.82 |
1.77 |
1.82 |
1.80 |
.03 |
Gain:Feed |
.375 |
.368 |
.377 |
.344 |
.357 |
.372 |
.01 |
Days to Market |
160.1 |
164.6 |
172.4 |
172.2 |
167.2 |
168.5 |
1.6 |
a 56 days of age (approximately 43 lb) to an average market weight of 250 lb.
Table 5. Genotype and sex means for Trial III.
|
EUR |
YL/Dur |
||
|---|---|---|---|---|
|
Barrows |
Gilts |
Barrows |
Gilts |
10th Rib Backfata |
.82 |
.70 |
.89 |
.83 |
|
Last Rib, % Midline Backfata |
.99 |
.89 |
1.05 |
.98 |
Loin Eye Areaa |
7.12 |
7.65 |
7.07 |
7.45 |
% Fat-Free Leana |
53.4 |
55.8 |
52.7 |
54.2 |
Grade Premiumb |
3.34 |
3.45 |
1.93 |
2.40 |
a Adjusted for carcass weight.
b Actual grade premium from IBF kill sheets ($/cwt carcass).
Figure 1. Performance of each genetic population-sex group, regressed
on the overall mean performance for each health environment-treatment.
SEW-AIAO = Early weaned, all-in/all-out; CON flo = Continuous flow;
+Vac +Anti = Vaccine + antibiotic treatment; -Vac -Anti = No medication
(control).
Environment-treatment means are:
SEW-AIAO +Vac +Anti = 163.1 days
SEW-AIAO -Vac -Anti = 165.4 days
CON flo +Vac +Anti = 172.3 days
CON flo +Vac +Anti = 180.7 days
Index of 1999 Purdue Swine Day Articles
If you have trouble accessing this page because of a disability, please email anscweb@purdue.edu.